29
/fr/
fr
AIzaSyAYiBZKx7MnpbEhh9jyipgxe19OcubqV5w
April 1, 2024
53591
Other small states
OSS
false
2
1
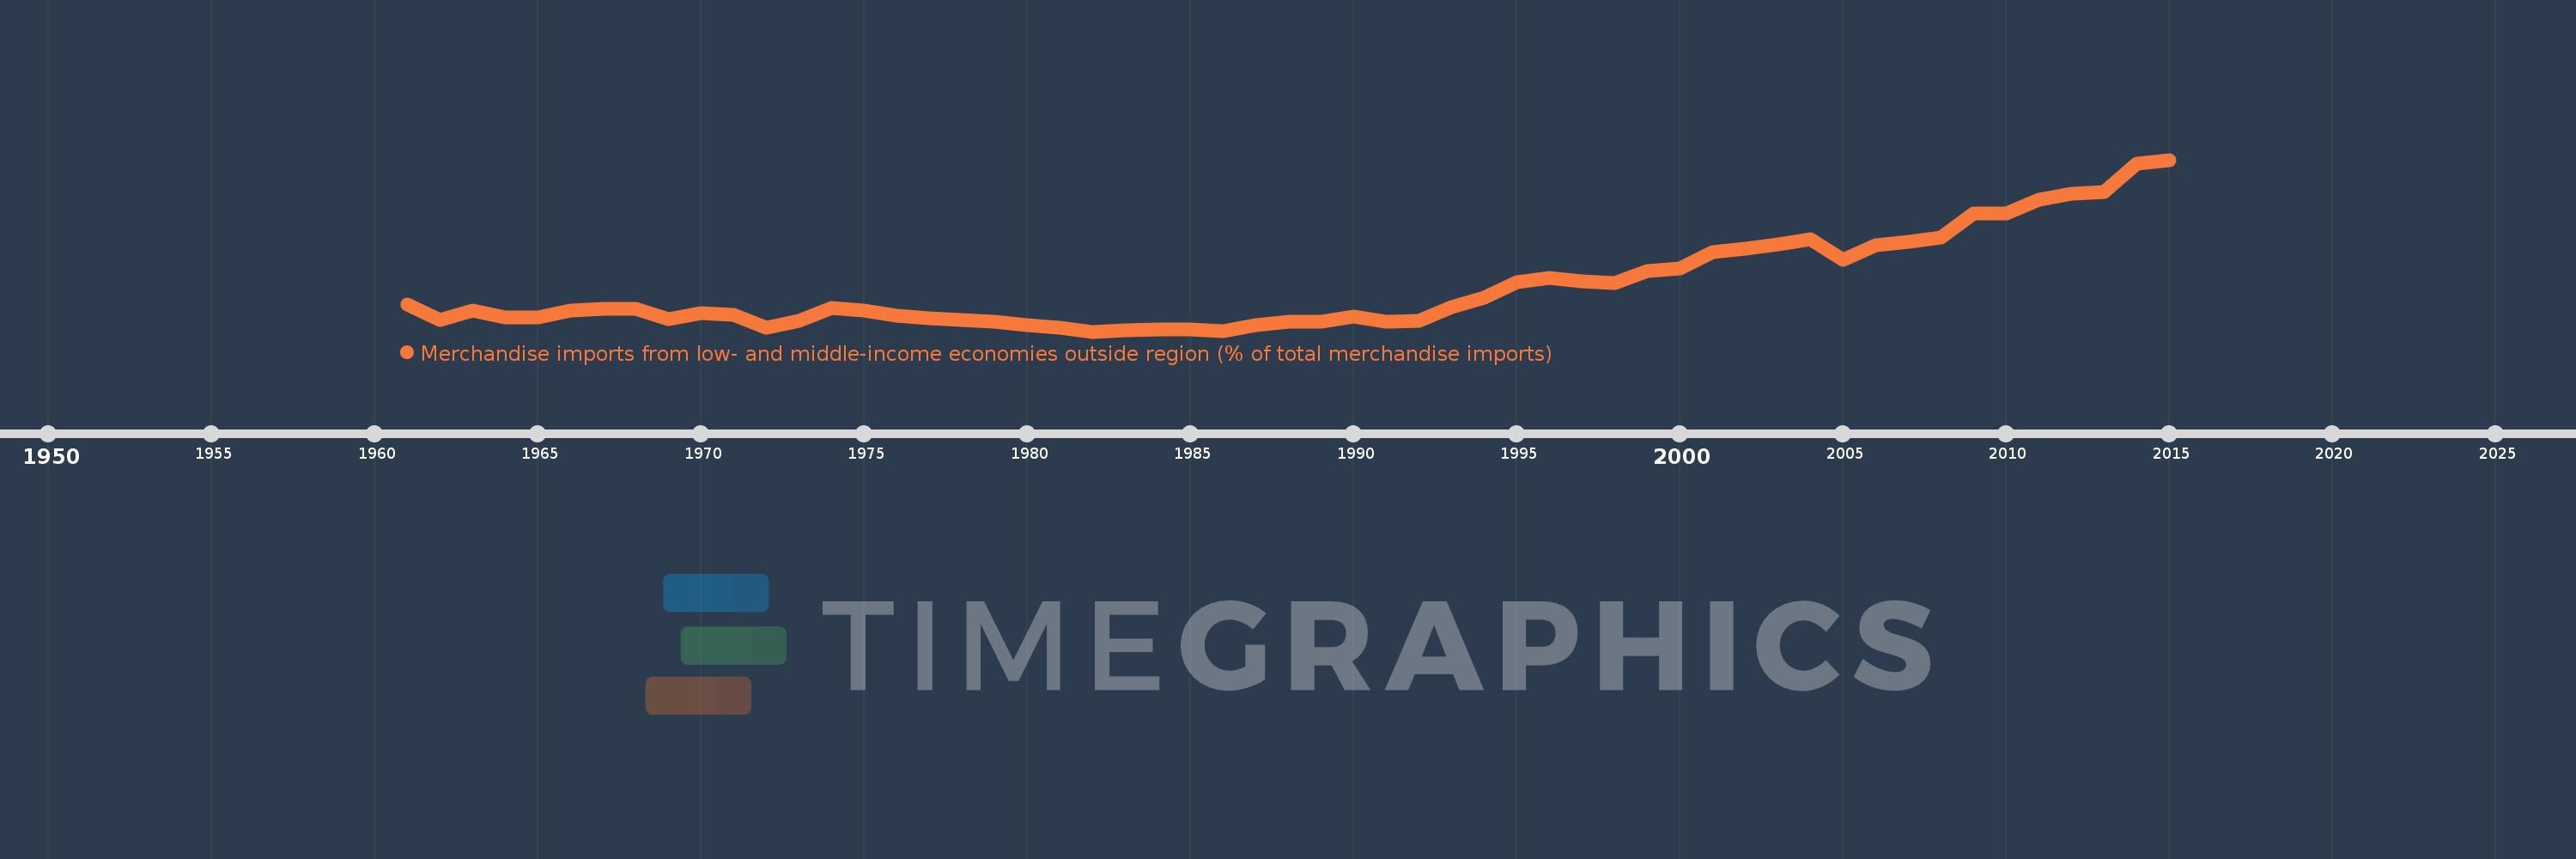
Merchandise imports from low- and middle-income economies outside region (% of total merchandise imports)
2015,2014,2013,2012,2011,2010,2009,2008,2007,2006,2005,2004,2003,2002,2001,2000,1999,1998,1997,1996,1995,1994,1993,1992,1991,1990,1989,1988,1987,1986,1985,1984,1983,1982,1981,1980,1979,1978,1977,1976,1975,1974,1973,1972,1971,1970,1969,1968,1967,1966,1965,1964,1963,1962,1961
Cette statistique dans les autres pays:
AfghanistanAlbaniaAlgeriaAngolaArab WorldArgentinaArmeniaArubaAustraliaAustriaAzerbaijanBahamas, TheBahrainBangladeshBarbadosBelarusBelgiumBelizeBeninBermudaBoliviaBrazilBrunei DarussalamBulgariaBurkina FasoBurundiCabo VerdeCambodiaCameroonCanadaCaribbean small statesCentral African RepublicCentral Europe and the BalticsChileChinaColombiaCongo, Dem. Rep.Congo, Rep.Costa RicaCote d'IvoireCroatiaCubaCyprusCzech RepublicDenmarkDominicaDominican RepublicEarly-demographic dividendEast Asia & PacificEast Asia & Pacific (excluding high income)East Asia & Pacific (IDA & IBRD countries)EcuadorEgypt, Arab Rep.El SalvadorEstoniaEthiopiaEuro areaEurope & Central AsiaEurope & Central Asia (excluding high income)Europe & Central Asia (IDA & IBRD countries)European UnionFijiFinlandFragile and conflict affected situationsFranceGabonGambia, TheGeorgiaGermanyGhanaGreeceGreenlandGrenadaGuatemalaGuineaGuyanaHaitiHeavily indebted poor countries (HIPC)High incomeHondurasHong Kong SAR, ChinaHungaryIBRD onlyIcelandIDA & IBRD totalIDA blendIDA onlyIDA totalIndiaIndonesiaIran, Islamic Rep.IraqIrelandIsraelItalyJamaicaJapanJordanKazakhstanKenyaKorea, Dem. People’s Rep.Korea, Rep.KuwaitKyrgyz RepublicLao PDRLate-demographic dividendLatin America & Caribbean Latin America & Caribbean (excluding high income)Latin America & the Caribbean (IDA & IBRD countries)LatviaLeast developed countries: UN classificationLebanonLiberiaLibyaLithuaniaLow & middle incomeLow incomeLower middle incomeLuxembourgMacao SAR, ChinaMacedonia, FYRMadagascarMalawiMalaysiaMaliMaltaMauritaniaMauritiusMexicoMiddle East & North AfricaMiddle East & North Africa (excluding high income)Middle East & North Africa (IDA & IBRD countries)Middle incomeMoldovaMongoliaMontenegroMoroccoMozambiqueMyanmarNetherlandsNew CaledoniaNew ZealandNicaraguaNigerNigeriaNorth AmericaNorwayOECD membersOmanOther small statesPacific island small statesPakistanPanamaPapua New GuineaParaguayPeruPhilippinesPolandPortugalPost-demographic dividendPre-demographic dividendQatarRomaniaRussian FederationRwandaSaudi ArabiaSenegalSerbiaSeychellesSierra LeoneSingaporeSlovak RepublicSloveniaSmall statesSomaliaSouth AfricaSouth AsiaSouth Asia (IDA & IBRD)SpainSri LankaSt. Kitts and NevisSt. LuciaSt. Vincent and the GrenadinesSub-Saharan Africa Sub-Saharan Africa (excluding high income)Sub-Saharan Africa (IDA & IBRD countries)SudanSurinameSwedenSwitzerlandSyrian Arab RepublicTanzaniaThailandTogoTrinidad and TobagoTunisiaTurkeyUgandaUkraineUnited Arab EmiratesUnited KingdomUnited StatesUpper middle incomeUruguayVenezuela, RBVietnamWorldYemen, Rep.ZambiaZimbabwe La ligne de temps
Cette échelle de temps montre un graphique de 1961 année à 2015 année Other small states. Les données jusqu'à 1960 année ne sont pas présentés. Quantité d'observations actuelles selon dates: 55.
Source (désignation):
Les indicateurs du développement mondiale
Source (organisation):
World Bank staff estimates based data from International Monetary Fund's Direction of Trade database.
Catégories:
Private Sector, Trade
Dernière mise à jour
23 avr. 2017
Les indicateurs de changement de valeurs selon les années
Minimum:
3.726
1 janv. 1982
Maximum:
23.872
1 janv. 2015
Pour la date d''observation
Valeur
Changement absolu
Le changement par rapport à la valeur précédente
1 janv. 1961
6.937
+6.937
0.0%
1 janv. 1962
5.073
-1.864
-26.87%
1 janv. 1963
6.215
+1.142
22.51%
1 janv. 1964
5.428
-0.787
-12.66%
1 janv. 1965
5.354
-0.074
-1.36%
1 janv. 1966
6.197
+0.843
15.75%
1 janv. 1967
6.355
+0.158
2.55%
1 janv. 1968
6.373
+0.018
0.29%
1 janv. 1969
5.212
-1.161
-18.21%
1 janv. 1970
5.925
+0.712
13.67%
1 janv. 1971
5.673
-0.252
-4.26%
1 janv. 1972
4.189
-1.483
-26.15%
1 janv. 1973
4.996
+0.806
19.25%
1 janv. 1974
6.496
+1.5
30.02%
1 janv. 1975
6.186
-0.309
-4.76%
1 janv. 1976
5.61
-0.576
-9.31%
1 janv. 1977
5.259
-0.352
-6.27%
1 janv. 1978
5.085
-0.174
-3.31%
1 janv. 1979
4.919
-0.166
-3.27%
1 janv. 1980
4.507
-0.412
-8.37%
1 janv. 1981
4.228
-0.279
-6.19%
1 janv. 1982
3.726
-0.502
-11.88%
1 janv. 1983
3.855
+0.129
3.47%
1 janv. 1984
3.953
+0.098
2.55%
1 janv. 1985
4.009
+0.056
1.41%
1 janv. 1986
3.78
-0.229
-5.71%
1 janv. 1987
4.5
+0.72
19.04%
1 janv. 1988
4.87
+0.37
8.22%
1 janv. 1989
4.87
+0.0
0.0%
1 janv. 1990
5.51
+0.64
13.14%
1 janv. 1991
4.868
-0.642
-11.65%
1 janv. 1992
4.972
+0.104
2.14%
1 janv. 1993
6.559
+1.587
31.92%
1 janv. 1994
7.722
+1.164
17.74%
1 janv. 1995
9.549
+1.827
23.66%
1 janv. 1996
10.035
+0.486
5.09%
1 janv. 1997
9.608
-0.426
-4.25%
1 janv. 1998
9.377
-0.232
-2.41%
1 janv. 1999
10.85
+1.473
15.71%
1 janv. 2000
11.17
+0.32
2.95%
1 janv. 2001
13.049
+1.879
16.82%
1 janv. 2002
13.469
+0.42
3.22%
1 janv. 2003
13.965
+0.496
3.68%
1 janv. 2004
14.523
+0.558
3.99%
1 janv. 2005
12.105
-2.418
-16.65%
1 janv. 2006
13.816
+1.711
14.14%
1 janv. 2007
14.23
+0.414
3.0%
1 janv. 2008
14.745
+0.515
3.62%
1 janv. 2009
17.54
+2.794
18.95%
1 janv. 2010
17.527
-0.013
-0.08%
1 janv. 2011
19.186
+1.659
9.47%
1 janv. 2012
19.862
+0.676
3.52%
1 janv. 2013
20.047
+0.185
0.93%
1 janv. 2014
23.422
+3.374
16.83%
1 janv. 2015
23.872
+0.45
1.92%
Classement des pays selon les statistiques actuelles par années


Commentaires: