29
/fr/
fr
AIzaSyAYiBZKx7MnpbEhh9jyipgxe19OcubqV5w
April 1, 2024
53590
Other small states
OSS
false
2
1
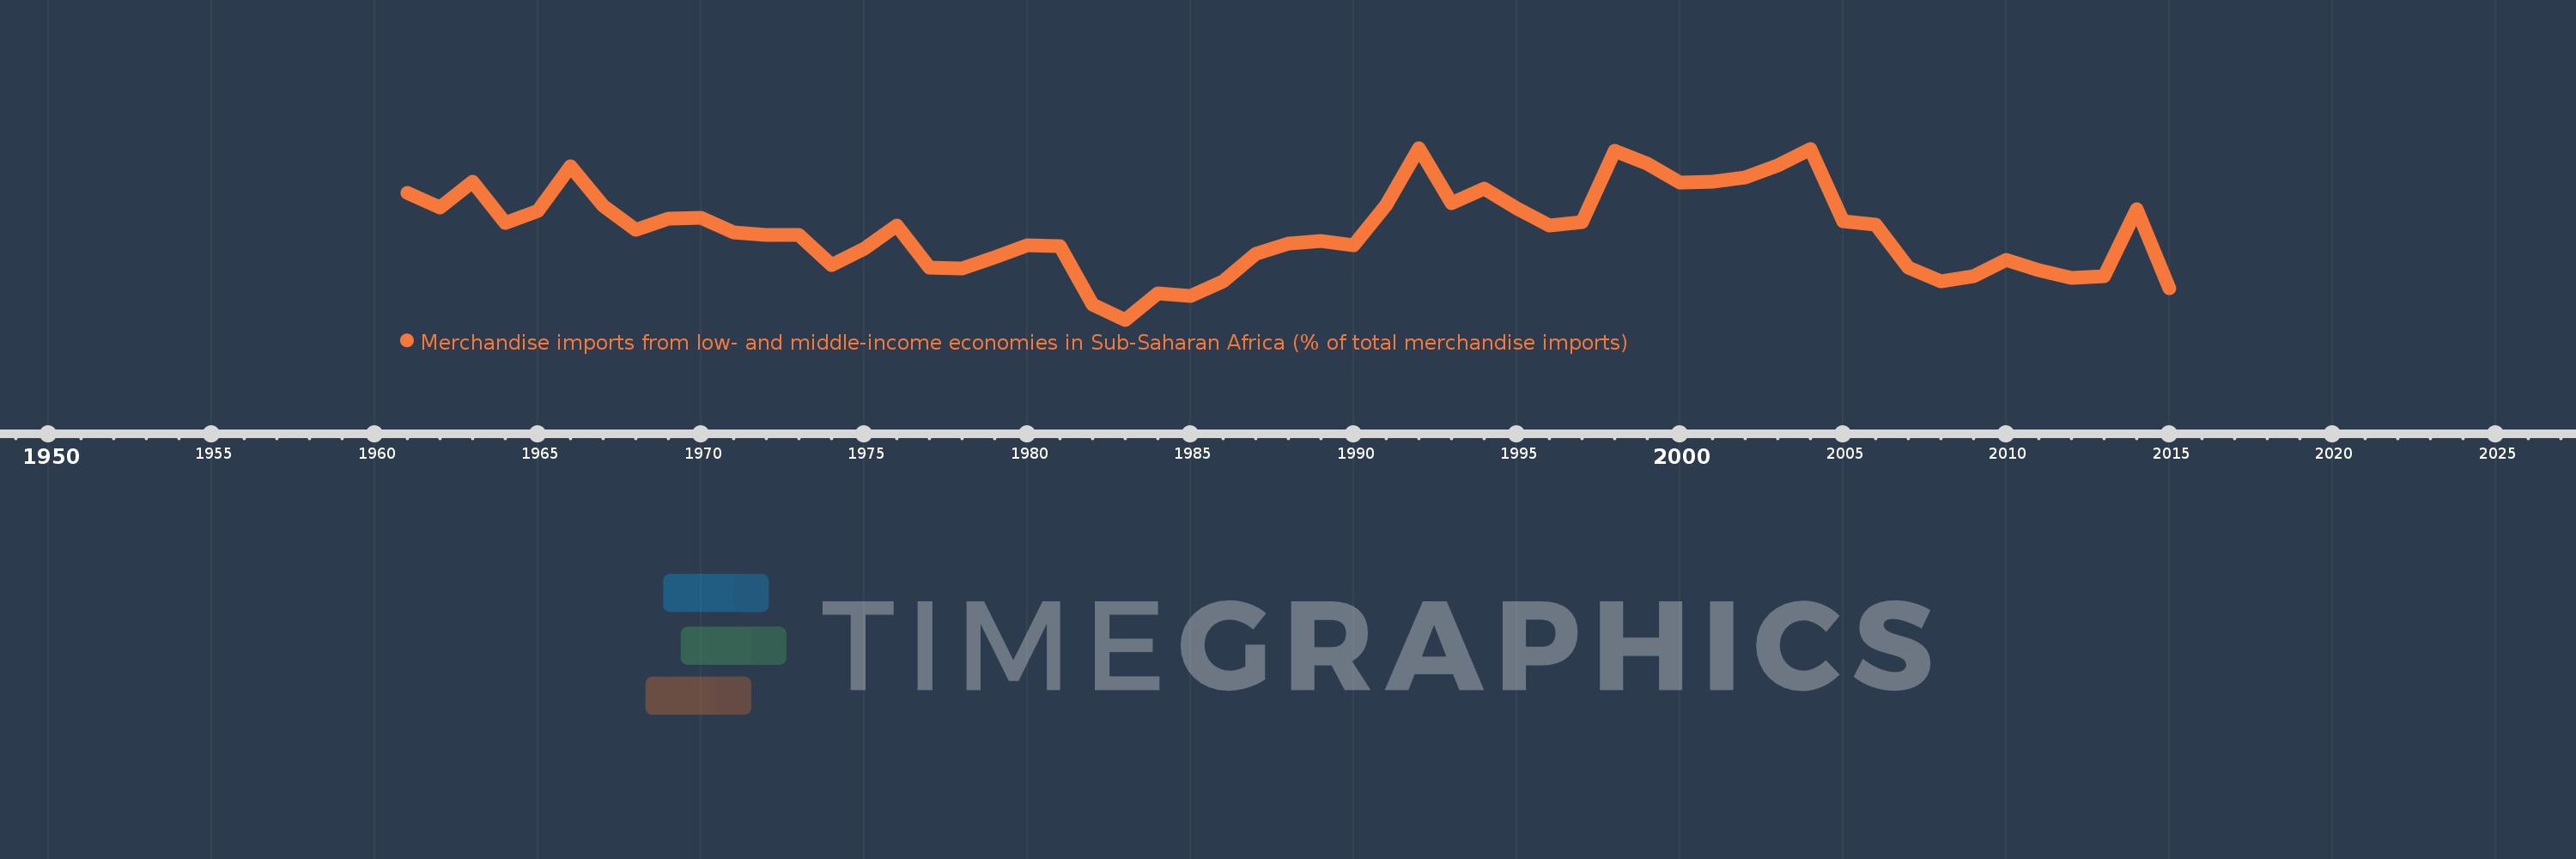
Merchandise imports from low- and middle-income economies in Sub-Saharan Africa (% of total merchandise imports)
2015,2014,2013,2012,2011,2010,2009,2008,2007,2006,2005,2004,2003,2002,2001,2000,1999,1998,1997,1996,1995,1994,1993,1992,1991,1990,1989,1988,1987,1986,1985,1984,1983,1982,1981,1980,1979,1978,1977,1976,1975,1974,1973,1972,1971,1970,1969,1968,1967,1966,1965,1964,1963,1962,1961
Cette statistique dans les autres pays:
AlbaniaAlgeriaAngolaArab WorldArgentinaArmeniaArubaAustraliaAustriaAzerbaijanBahamas, TheBahrainBangladeshBarbadosBelarusBelgiumBelizeBeninBermudaBoliviaBrazilBrunei DarussalamBulgariaBurkina FasoBurundiCabo VerdeCambodiaCameroonCanadaCaribbean small statesCentral African RepublicCentral Europe and the BalticsChadChileChinaColombiaCongo, Dem. Rep.Congo, Rep.Costa RicaCote d'IvoireCroatiaCubaCyprusCzech RepublicDenmarkDjiboutiDominicaDominican RepublicEarly-demographic dividendEast Asia & PacificEast Asia & Pacific (excluding high income)East Asia & Pacific (IDA & IBRD countries)EcuadorEgypt, Arab Rep.El SalvadorEstoniaEthiopiaEuro areaEurope & Central AsiaEurope & Central Asia (excluding high income)Europe & Central Asia (IDA & IBRD countries)European UnionFijiFinlandFragile and conflict affected situationsFranceGabonGambia, TheGeorgiaGermanyGhanaGreeceGreenlandGrenadaGuatemalaGuineaGuinea-BissauGuyanaHaitiHeavily indebted poor countries (HIPC)High incomeHondurasHong Kong SAR, ChinaHungaryIBRD onlyIcelandIDA & IBRD totalIDA blendIDA onlyIDA totalIndiaIndonesiaIran, Islamic Rep.IraqIrelandIsraelItalyJamaicaJapanJordanKazakhstanKenyaKorea, Dem. People’s Rep.Korea, Rep.KuwaitLao PDRLate-demographic dividendLatin America & Caribbean Latin America & Caribbean (excluding high income)Latin America & the Caribbean (IDA & IBRD countries)LatviaLeast developed countries: UN classificationLebanonLiberiaLibyaLithuaniaLow & middle incomeLow incomeLower middle incomeLuxembourgMacao SAR, ChinaMacedonia, FYRMadagascarMalawiMalaysiaMaliMaltaMauritaniaMauritiusMexicoMiddle East & North AfricaMiddle East & North Africa (excluding high income)Middle East & North Africa (IDA & IBRD countries)Middle incomeMoldovaMontenegroMoroccoMozambiqueMyanmarNetherlandsNew CaledoniaNew ZealandNicaraguaNigerNigeriaNorth AmericaNorwayOECD membersOmanOther small statesPacific island small statesPakistanPanamaPapua New GuineaParaguayPeruPhilippinesPolandPortugalPost-demographic dividendPre-demographic dividendQatarRomaniaRussian FederationRwandaSaudi ArabiaSenegalSerbiaSeychellesSierra LeoneSingaporeSlovak RepublicSloveniaSmall statesSomaliaSouth AfricaSouth AsiaSouth Asia (IDA & IBRD)SpainSri LankaSt. LuciaSt. Vincent and the GrenadinesSub-Saharan Africa Sub-Saharan Africa (excluding high income)Sub-Saharan Africa (IDA & IBRD countries)SudanSurinameSwedenSwitzerlandSyrian Arab RepublicTanzaniaThailandTogoTrinidad and TobagoTunisiaTurkeyUgandaUkraineUnited Arab EmiratesUnited KingdomUnited StatesUpper middle incomeUruguayVenezuela, RBVietnamWorldYemen, Rep.ZambiaZimbabwe La ligne de temps
Cette échelle de temps montre un graphique de 1961 année à 2015 année Other small states. Les données jusqu'à 1960 année ne sont pas présentés. Quantité d'observations actuelles selon dates: 55.
Source (désignation):
Les indicateurs du développement mondiale
Source (organisation):
World Bank staff estimates based data from International Monetary Fund's Direction of Trade database.
Catégories:
Private Sector, Trade
Dernière mise à jour
23 avr. 2017
Les indicateurs de changement de valeurs selon les années
Maximum:
2.921
1 janv. 1992
Pour la date d''observation
Valeur
Changement absolu
Le changement par rapport à la valeur précédente
1 janv. 1961
2.409
+2.409
0.0%
1 janv. 1962
2.242
-0.167
-6.94%
1 janv. 1963
2.535
+0.293
13.05%
1 janv. 1964
2.069
-0.466
-18.39%
1 janv. 1965
2.204
+0.136
6.57%
1 janv. 1966
2.71
+0.505
22.92%
1 janv. 1967
2.262
-0.447
-16.5%
1 janv. 1968
1.984
-0.279
-12.31%
1 janv. 1969
2.114
+0.13
6.57%
1 janv. 1970
2.125
+0.011
0.53%
1 janv. 1971
1.96
-0.165
-7.77%
1 janv. 1972
1.924
-0.036
-1.84%
1 janv. 1973
1.928
+0.004
0.21%
1 janv. 1974
1.589
-0.339
-17.6%
1 janv. 1975
1.774
+0.185
11.63%
1 janv. 1976
2.036
+0.262
14.8%
1 janv. 1977
1.552
-0.484
-23.78%
1 janv. 1978
1.542
-0.01
-0.62%
1 janv. 1979
1.674
+0.131
8.52%
1 janv. 1980
1.81
+0.136
8.14%
1 janv. 1981
1.797
-0.013
-0.73%
1 janv. 1982
1.138
-0.659
-36.65%
1 janv. 1983
0.96
-0.179
-15.69%
1 janv. 1984
1.258
+0.298
31.08%
1 janv. 1985
1.235
-0.023
-1.85%
1 janv. 1986
1.401
+0.166
13.46%
1 janv. 1987
1.709
+0.308
21.98%
1 janv. 1988
1.829
+0.12
7.03%
1 janv. 1989
1.856
+0.027
1.5%
1 janv. 1990
1.812
-0.045
-2.41%
1 janv. 1991
2.27
+0.458
25.28%
1 janv. 1992
2.921
+0.651
28.7%
1 janv. 1993
2.286
-0.635
-21.73%
1 janv. 1994
2.453
+0.167
7.3%
1 janv. 1995
2.236
-0.218
-8.87%
1 janv. 1996
2.038
-0.197
-8.83%
1 janv. 1997
2.072
+0.033
1.63%
1 janv. 1998
2.89
+0.819
39.53%
1 janv. 1999
2.738
-0.152
-5.26%
1 janv. 2000
2.523
-0.216
-7.87%
1 janv. 2001
2.533
+0.01
0.41%
1 janv. 2002
2.586
+0.053
2.1%
1 janv. 2003
2.719
+0.133
5.15%
1 janv. 2004
2.911
+0.192
7.05%
1 janv. 2005
2.083
-0.829
-28.46%
1 janv. 2006
2.047
-0.035
-1.69%
1 janv. 2007
1.557
-0.491
-23.96%
1 janv. 2008
1.395
-0.161
-10.37%
1 janv. 2009
1.453
+0.058
4.16%
1 janv. 2010
1.641
+0.188
12.91%
1 janv. 2011
1.529
-0.112
-6.83%
1 janv. 2012
1.437
-0.092
-6.02%
1 janv. 2013
1.46
+0.023
1.59%
1 janv. 2014
2.224
+0.764
52.31%
1 janv. 2015
1.319
-0.904
-40.67%
Classement des pays selon les statistiques actuelles par années


Commentaires: