29
/fr/
fr
AIzaSyAYiBZKx7MnpbEhh9jyipgxe19OcubqV5w
April 1, 2024
52765
OECD members
OED
false
2
1
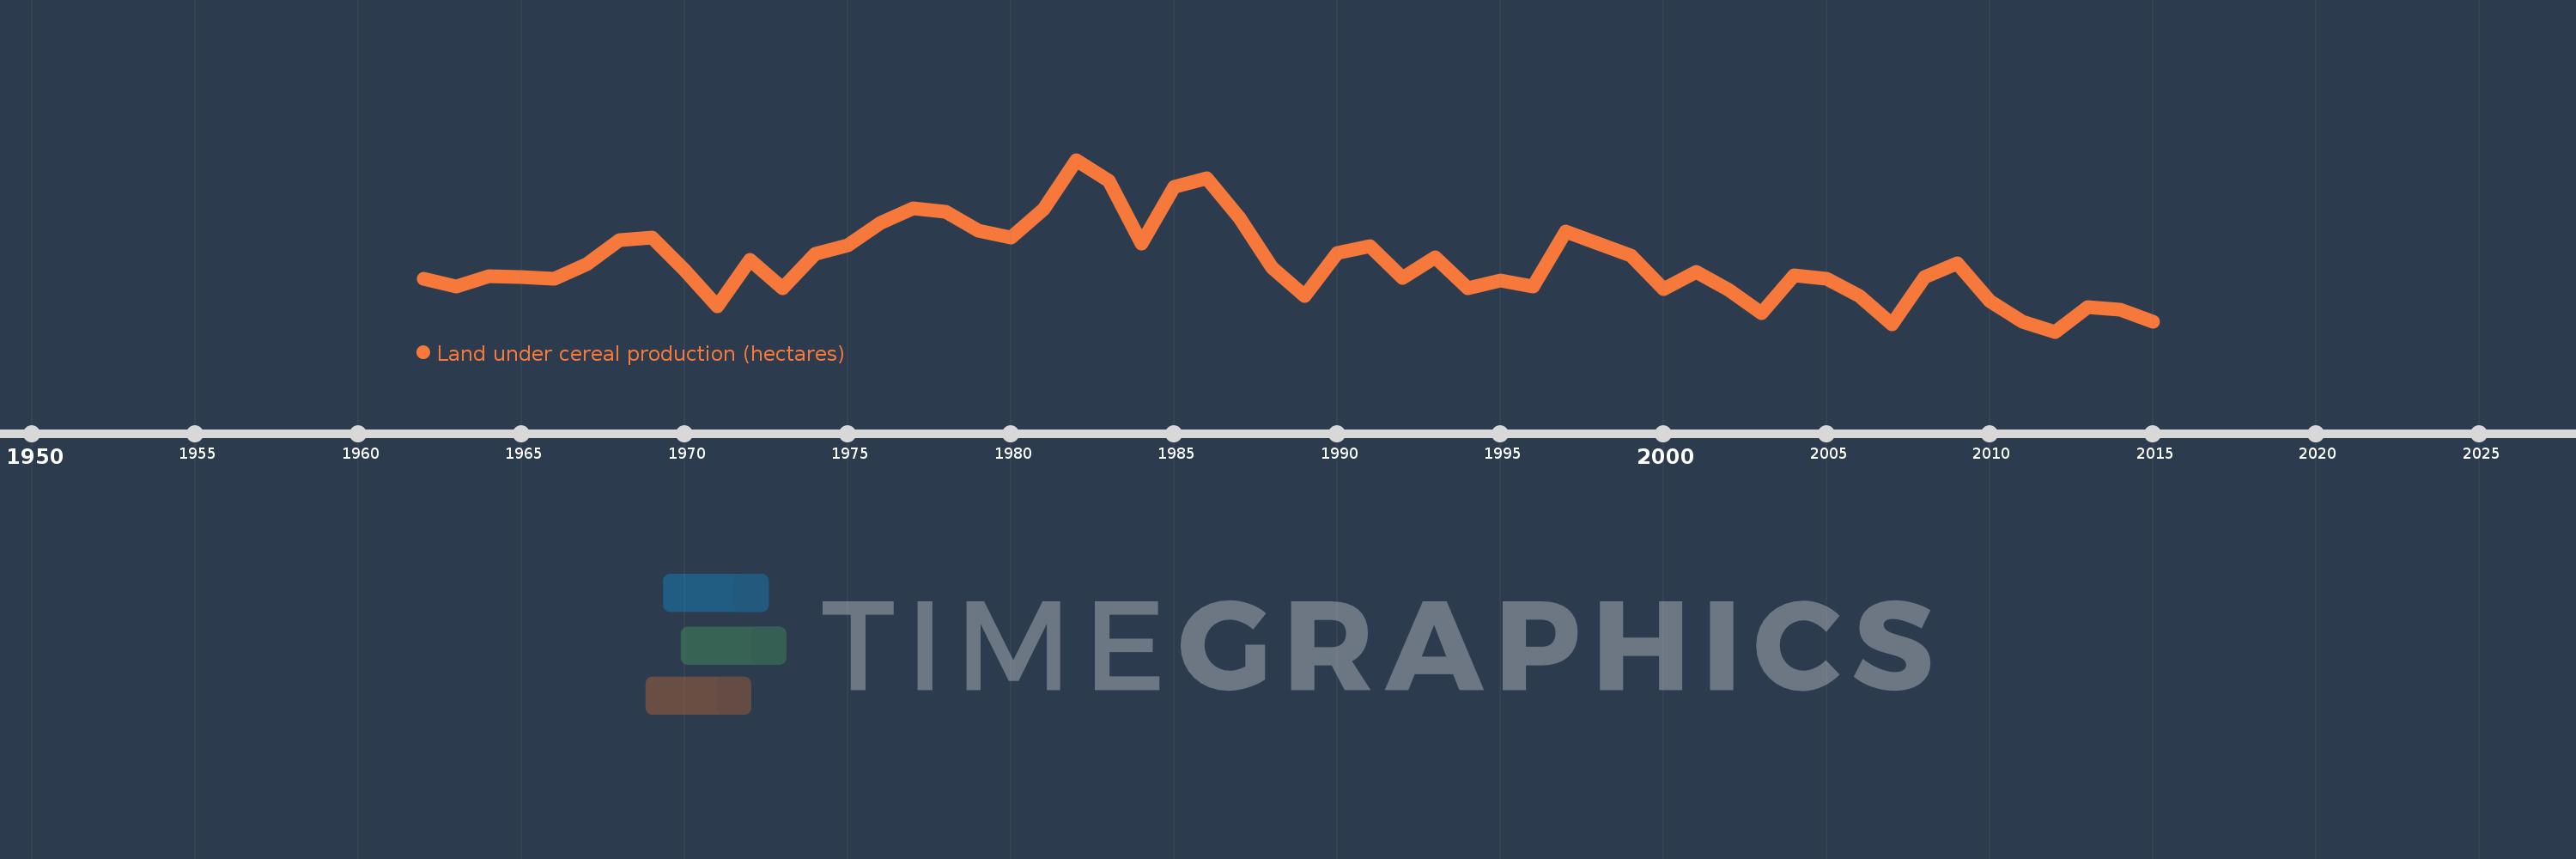
Land under cereal production (hectares)
2015,2014,2013,2012,2011,2010,2009,2008,2007,2006,2005,2004,2003,2002,2001,2000,1999,1998,1997,1996,1995,1994,1993,1992,1991,1990,1989,1988,1987,1986,1985,1984,1983,1982,1981,1980,1979,1978,1977,1976,1975,1974,1973,1972,1971,1970,1969,1968,1967,1966,1965,1964,1963,1962
Cette statistique dans les autres pays:
AfghanistanAlbaniaAlgeriaAngolaAntigua and BarbudaArab WorldArgentinaArmeniaAustraliaAustriaAzerbaijanBahamas, TheBangladeshBarbadosBelarusBelgiumBelizeBeninBhutanBoliviaBosnia and HerzegovinaBotswanaBrazilBrunei DarussalamBulgariaBurkina FasoBurundiCabo VerdeCambodiaCameroonCanadaCaribbean small statesCentral African RepublicCentral Europe and the BalticsChadChileChinaColombiaComorosCongo, Dem. Rep.Congo, Rep.Costa RicaCote d'IvoireCroatiaCubaCyprusCzech RepublicDenmarkDjiboutiDominicaDominican RepublicEarly-demographic dividendEast Asia & PacificEast Asia & Pacific (excluding high income)East Asia & Pacific (IDA & IBRD countries)EcuadorEgypt, Arab Rep.El SalvadorEritreaEstoniaEthiopiaEuro areaEurope & Central AsiaEurope & Central Asia (excluding high income)Europe & Central Asia (IDA & IBRD countries)European UnionFijiFinlandFragile and conflict affected situationsFranceGabonGambia, TheGeorgiaGermanyGhanaGreeceGrenadaGuamGuatemalaGuineaGuinea-BissauGuyanaHaitiHeavily indebted poor countries (HIPC)High incomeHondurasHong Kong SAR, ChinaHungaryIBRD onlyIDA & IBRD totalIDA blendIDA onlyIDA totalIndiaIndonesiaIran, Islamic Rep.IraqIrelandIsraelItalyJamaicaJapanJordanKazakhstanKenyaKorea, Dem. People’s Rep.Korea, Rep.KuwaitKyrgyz RepublicLao PDRLate-demographic dividendLatin America & Caribbean Latin America & Caribbean (excluding high income)Latin America & the Caribbean (IDA & IBRD countries)LatviaLeast developed countries: UN classificationLebanonLesothoLiberiaLibyaLithuaniaLow & middle incomeLow incomeLower middle incomeLuxembourgMacedonia, FYRMadagascarMalawiMalaysiaMaldivesMaliMaltaMauritaniaMauritiusMexicoMicronesia, Fed. Sts.Middle East & North AfricaMiddle East & North Africa (excluding high income)Middle East & North Africa (IDA & IBRD countries)Middle incomeMoldovaMongoliaMontenegroMoroccoMozambiqueMyanmarNamibiaNepalNetherlandsNew CaledoniaNew ZealandNicaraguaNigerNigeriaNorth AmericaNorwayOECD membersOmanOther small statesPacific island small statesPakistanPanamaPapua New GuineaParaguayPeruPhilippinesPolandPortugalPost-demographic dividendPre-demographic dividendPuerto RicoQatarRomaniaRussian FederationRwandaSao Tome and PrincipeSaudi ArabiaSenegalSerbiaSierra LeoneSlovak RepublicSloveniaSmall statesSolomon IslandsSomaliaSouth AfricaSouth AsiaSouth Asia (IDA & IBRD)South SudanSpainSri LankaSt. LuciaSt. Vincent and the GrenadinesSub-Saharan Africa Sub-Saharan Africa (excluding high income)Sub-Saharan Africa (IDA & IBRD countries)SudanSurinameSwazilandSwedenSwitzerlandSyrian Arab RepublicTajikistanTanzaniaThailandTimor-LesteTogoTrinidad and TobagoTunisiaTurkeyTurkmenistanUgandaUkraineUnited Arab EmiratesUnited KingdomUnited StatesUpper middle incomeUruguayUzbekistanVanuatuVenezuela, RBVietnamWest Bank and GazaWorldYemen, Rep.ZambiaZimbabwe La ligne de temps
Cette échelle de temps montre un graphique de 1962 année à 2015 année OECD members. Les données jusqu'à 1961 année ne sont pas présentés. Quantité d'observations actuelles selon dates: 54.
Source (désignation):
Les indicateurs du développement mondiale
Source (organisation):
Food and Agriculture Organization, electronic files and web site.
Catégories:
Agriculture & Rural Development
Dernière mise à jour
23 avr. 2017
Les indicateurs de changement de valeurs selon les années
Minimum:
162.744 mln.
1 janv. 2012
Maximum:
199.693 mln.
1 janv. 1982
Pour la date d''observation
Valeur
Changement absolu
Le changement par rapport à la valeur précédente
1 janv. 1962
174.023 mln.
+174.023 mln.
0.0%
1 janv. 1963
172.405 mln.
-1.618 mln.
-0.93%
1 janv. 1964
174.651 mln.
+2.246 mln.
1.3%
1 janv. 1965
174.549 mln.
-101.663 milles
-0.06%
1 janv. 1966
174.142 mln.
-407.736 milles
-0.23%
1 janv. 1967
177.335 mln.
+3.194 mln.
1.83%
1 janv. 1968
182.331 mln.
+4.996 mln.
2.82%
1 janv. 1969
182.966 mln.
+634.562 milles
0.35%
1 janv. 1970
175.945 mln.
-7.02 mln.
-3.84%
1 janv. 1971
168.137 mln.
-7.808 mln.
-4.44%
1 janv. 1972
178.232 mln.
+10.095 mln.
6.0%
1 janv. 1973
172.056 mln.
-6.176 mln.
-3.47%
1 janv. 1974
179.445 mln.
+7.389 mln.
4.29%
1 janv. 1975
181.339 mln.
+1.894 mln.
1.06%
1 janv. 1976
186.152 mln.
+4.812 mln.
2.65%
1 janv. 1977
189.222 mln.
+3.07 mln.
1.65%
1 janv. 1978
188.483 mln.
-738.377 milles
-0.39%
1 janv. 1979
184.471 mln.
-4.012 mln.
-2.13%
1 janv. 1980
182.914 mln.
-1.557 mln.
-0.84%
1 janv. 1981
189.099 mln.
+6.185 mln.
3.38%
1 janv. 1982
199.693 mln.
+10.594 mln.
5.6%
1 janv. 1983
195.078 mln.
-4.615 mln.
-2.31%
1 janv. 1984
181.765 mln.
-13.313 mln.
-6.82%
1 janv. 1985
193.807 mln.
+12.042 mln.
6.63%
1 janv. 1986
195.695 mln.
+1.888 mln.
0.97%
1 janv. 1987
187.177 mln.
-8.517 mln.
-4.35%
1 janv. 1988
176.457 mln.
-10.72 mln.
-5.73%
1 janv. 1989
170.386 mln.
-6.072 mln.
-3.44%
1 janv. 1990
179.647 mln.
+9.262 mln.
5.44%
1 janv. 1991
181.133 mln.
+1.485 mln.
0.83%
1 janv. 1992
174.262 mln.
-6.87 mln.
-3.79%
1 janv. 1993
178.685 mln.
+4.423 mln.
2.54%
1 janv. 1994
172.07 mln.
-6.616 mln.
-3.7%
1 janv. 1995
173.69 mln.
+1.62 mln.
0.94%
1 janv. 1996
172.4 mln.
-1.289 mln.
-0.74%
1 janv. 1997
184.223 mln.
+11.823 mln.
6.86%
1 janv. 1998
181.731 mln.
-2.492 mln.
-1.35%
1 janv. 1999
179.059 mln.
-2.672 mln.
-1.47%
1 janv. 2000
171.917 mln.
-7.142 mln.
-3.99%
1 janv. 2001
175.539 mln.
+3.623 mln.
2.11%
1 janv. 2002
171.733 mln.
-3.806 mln.
-2.17%
1 janv. 2003
166.723 mln.
-5.01 mln.
-2.92%
1 janv. 2004
174.936 mln.
+8.213 mln.
4.93%
1 janv. 2005
174.145 mln.
-790.964 milles
-0.45%
1 janv. 2006
170.469 mln.
-3.676 mln.
-2.11%
1 janv. 2007
164.399 mln.
-6.07 mln.
-3.56%
1 janv. 2008
174.482 mln.
+10.083 mln.
6.13%
1 janv. 2009
177.412 mln.
+2.93 mln.
1.68%
1 janv. 2010
169.226 mln.
-8.186 mln.
-4.61%
1 janv. 2011
164.833 mln.
-4.393 mln.
-2.6%
1 janv. 2012
162.744 mln.
-2.089 mln.
-1.27%
1 janv. 2013
168.052 mln.
+5.308 mln.
3.26%
1 janv. 2014
167.543 mln.
-509.002 milles
-0.3%
1 janv. 2015
164.868 mln.
-2.675 mln.
-1.6%
Classement des pays selon les statistiques actuelles par années


Commentaires: