29
/fr/
fr
AIzaSyAYiBZKx7MnpbEhh9jyipgxe19OcubqV5w
April 1, 2024
52641
OECD members
OED
false
2
1
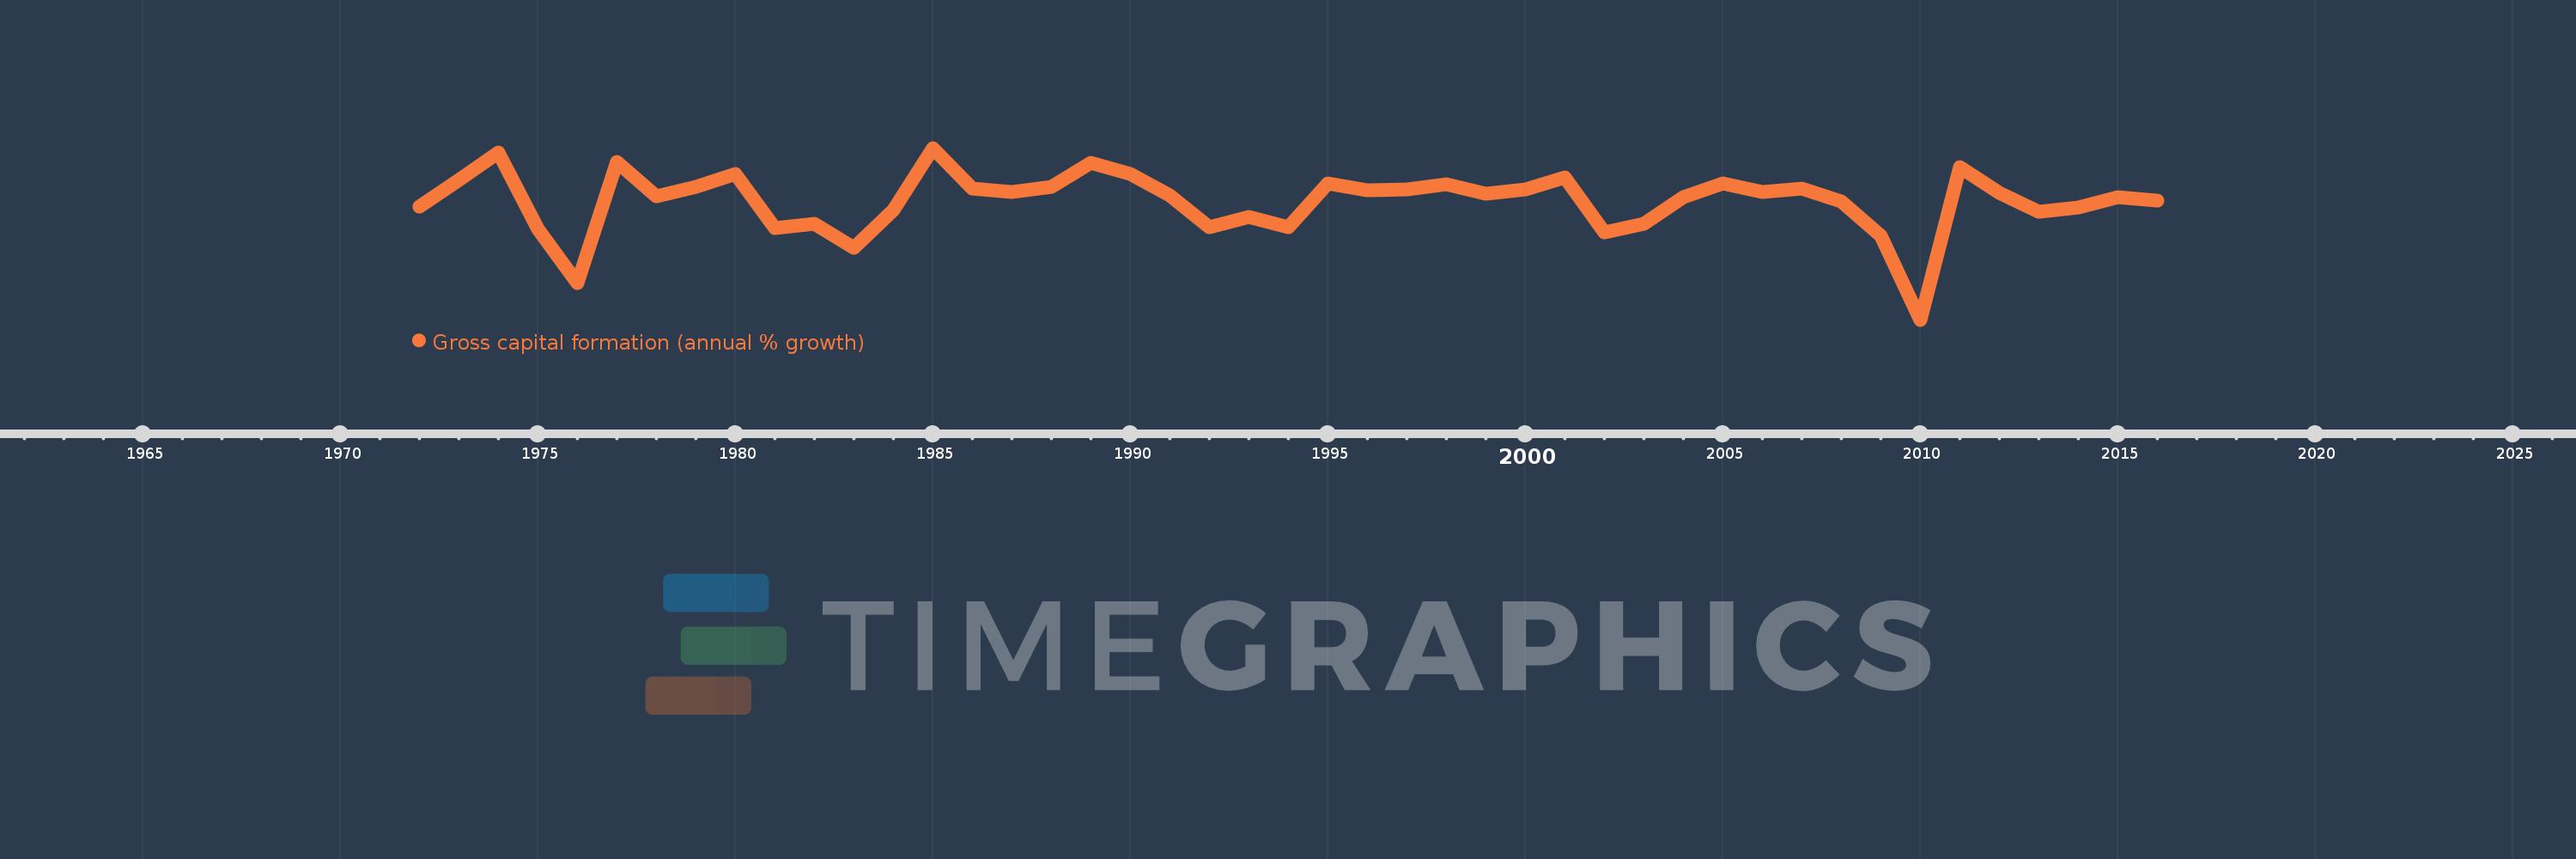
Gross capital formation (annual % growth)
2016,2015,2014,2013,2012,2011,2010,2009,2008,2007,2006,2005,2004,2003,2002,2001,2000,1999,1998,1997,1996,1995,1994,1993,1992,1991,1990,1989,1988,1987,1986,1985,1984,1983,1982,1981,1980,1979,1978,1977,1976,1975,1974,1973,1972
Cette statistique dans les autres pays:
AlbaniaAlgeriaAntigua and BarbudaArab WorldArgentinaArmeniaAustraliaAustriaAzerbaijanBahamas, TheBahrainBangladeshBarbadosBelarusBelgiumBelizeBeninBhutanBoliviaBosnia and HerzegovinaBotswanaBrazilBrunei DarussalamBulgariaBurkina FasoBurundiCabo VerdeCambodiaCameroonCanadaCaribbean small statesCentral Europe and the BalticsChadChileChinaColombiaComorosCongo, Dem. Rep.Congo, Rep.Costa RicaCote d'IvoireCroatiaCubaCyprusCzech RepublicDenmarkDjiboutiDominican RepublicEarly-demographic dividendEast Asia & PacificEast Asia & Pacific (excluding high income)East Asia & Pacific (IDA & IBRD countries)EcuadorEgypt, Arab Rep.El SalvadorEquatorial GuineaEritreaEstoniaEthiopiaEuro areaEurope & Central AsiaEurope & Central Asia (excluding high income)Europe & Central Asia (IDA & IBRD countries)European UnionFijiFinlandFranceGabonGambia, TheGeorgiaGermanyGhanaGreeceGuatemalaGuineaGuinea-BissauHaitiHeavily indebted poor countries (HIPC)High incomeHondurasHong Kong SAR, ChinaHungaryIBRD onlyIcelandIDA & IBRD totalIDA blendIDA onlyIDA totalIndiaIndonesiaIran, Islamic Rep.IrelandIsraelItalyJamaicaJapanJordanKazakhstanKenyaKorea, Rep.KosovoKuwaitKyrgyz RepublicLao PDRLate-demographic dividendLatin America & Caribbean Latin America & Caribbean (excluding high income)Latin America & the Caribbean (IDA & IBRD countries)LatviaLeast developed countries: UN classificationLebanonLiberiaLithuaniaLow & middle incomeLow incomeLower middle incomeLuxembourgMacao SAR, ChinaMacedonia, FYRMadagascarMalawiMalaysiaMaliMaltaMauritaniaMauritiusMexicoMiddle East & North AfricaMiddle East & North Africa (excluding high income)Middle East & North Africa (IDA & IBRD countries)Middle incomeMoldovaMongoliaMontenegroMoroccoMozambiqueNamibiaNepalNetherlandsNew ZealandNicaraguaNigerNigeriaNorth AmericaNorwayOECD membersOmanOther small statesPakistanPanamaPapua New GuineaParaguayPeruPhilippinesPolandPortugalPost-demographic dividendPre-demographic dividendPuerto RicoQatarRomaniaRussian FederationRwandaSaudi ArabiaSenegalSerbiaSeychellesSierra LeoneSingaporeSlovak RepublicSloveniaSmall statesSomaliaSouth AfricaSouth AsiaSouth Asia (IDA & IBRD)South SudanSpainSri LankaSub-Saharan Africa Sub-Saharan Africa (excluding high income)Sub-Saharan Africa (IDA & IBRD countries)SudanSurinameSwazilandSwedenSwitzerlandSyrian Arab RepublicTajikistanTanzaniaThailandTimor-LesteTogoTrinidad and TobagoTunisiaTurkeyTurkmenistanUgandaUkraineUnited Arab EmiratesUnited KingdomUnited StatesUpper middle incomeUruguayUzbekistanVanuatuVenezuela, RBVietnamWest Bank and GazaWorldZimbabwe La ligne de temps
Cette échelle de temps montre un graphique de 1972 année à 2016 année OECD members. Les données jusqu'à 1971 année ne sont pas présentés. Quantité d'observations actuelles selon dates: 45.
Source (désignation):
Les indicateurs du développement mondiale
Source (organisation):
World Bank national accounts data, and OECD National Accounts data files.
Catégories:
Economy & Growth
Dernière mise à jour
23 avr. 2017
Les indicateurs de changement de valeurs selon les années
Minimum:
-15.533
1 janv. 2010
Maximum:
10.64
1 janv. 1985
Pour la date d''observation
Valeur
Changement absolu
Le changement par rapport à la valeur précédente
1 janv. 1972
1.669
+1.669
0.0%
1 janv. 1973
5.716
+4.046
242.41%
1 janv. 1974
9.972
+4.256
74.46%
1 janv. 1975
-1.731
-11.703
-117.36%
1 janv. 1976
-9.897
-8.166
471.71%
1 janv. 1977
8.49
+18.387
-185.78%
1 janv. 1978
3.327
-5.163
-60.81%
1 janv. 1979
4.67
+1.343
40.38%
1 janv. 1980
6.628
+1.958
41.92%
1 janv. 1981
-1.573
-8.201
-123.74%
1 janv. 1982
-0.871
+0.702
-44.61%
1 janv. 1983
-4.576
-3.705
425.16%
1 janv. 1984
1.192
+5.768
-126.05%
1 janv. 1985
10.64
+9.448
792.73%
1 janv. 1986
4.458
-6.183
-58.1%
1 janv. 1987
3.884
-0.574
-12.87%
1 janv. 1988
4.745
+0.86
22.15%
1 janv. 1989
8.42
+3.675
77.46%
1 janv. 1990
6.707
-1.713
-20.35%
1 janv. 1991
3.405
-3.301
-49.22%
1 janv. 1992
-1.444
-4.85
-142.42%
1 janv. 1993
0.071
+1.516
-104.95%
1 janv. 1994
-1.403
-1.474
-2.06 milles%
1 janv. 1995
5.214
+6.617
-471.63%
1 janv. 1996
4.16
-1.054
-20.21%
1 janv. 1997
4.255
+0.095
2.28%
1 janv. 1998
5.164
+0.909
21.36%
1 janv. 1999
3.613
-1.552
-30.04%
1 janv. 2000
4.282
+0.669
18.52%
1 janv. 2001
6.149
+1.868
43.62%
1 janv. 2002
-2.271
-8.42
-136.92%
1 janv. 2003
-0.863
+1.408
-62.0%
1 janv. 2004
3.118
+3.981
-461.43%
1 janv. 2005
5.185
+2.067
66.28%
1 janv. 2006
3.904
-1.281
-24.71%
1 janv. 2007
4.473
+0.57
14.59%
1 janv. 2008
2.468
-2.005
-44.82%
1 janv. 2009
-2.804
-5.272
-213.59%
1 janv. 2010
-15.533
-12.729
454.01%
1 janv. 2011
7.683
+23.216
-149.47%
1 janv. 2012
3.797
-3.886
-50.58%
1 janv. 2013
0.952
-2.845
-74.94%
1 janv. 2014
1.603
+0.651
68.45%
1 janv. 2015
3.147
+1.544
96.3%
1 janv. 2016
2.591
-0.555
-17.65%
Classement des pays selon les statistiques actuelles par années


Commentaires: