29
/fr/
fr
AIzaSyAYiBZKx7MnpbEhh9jyipgxe19OcubqV5w
April 1, 2024
52540
OECD members
OED
false
2
1
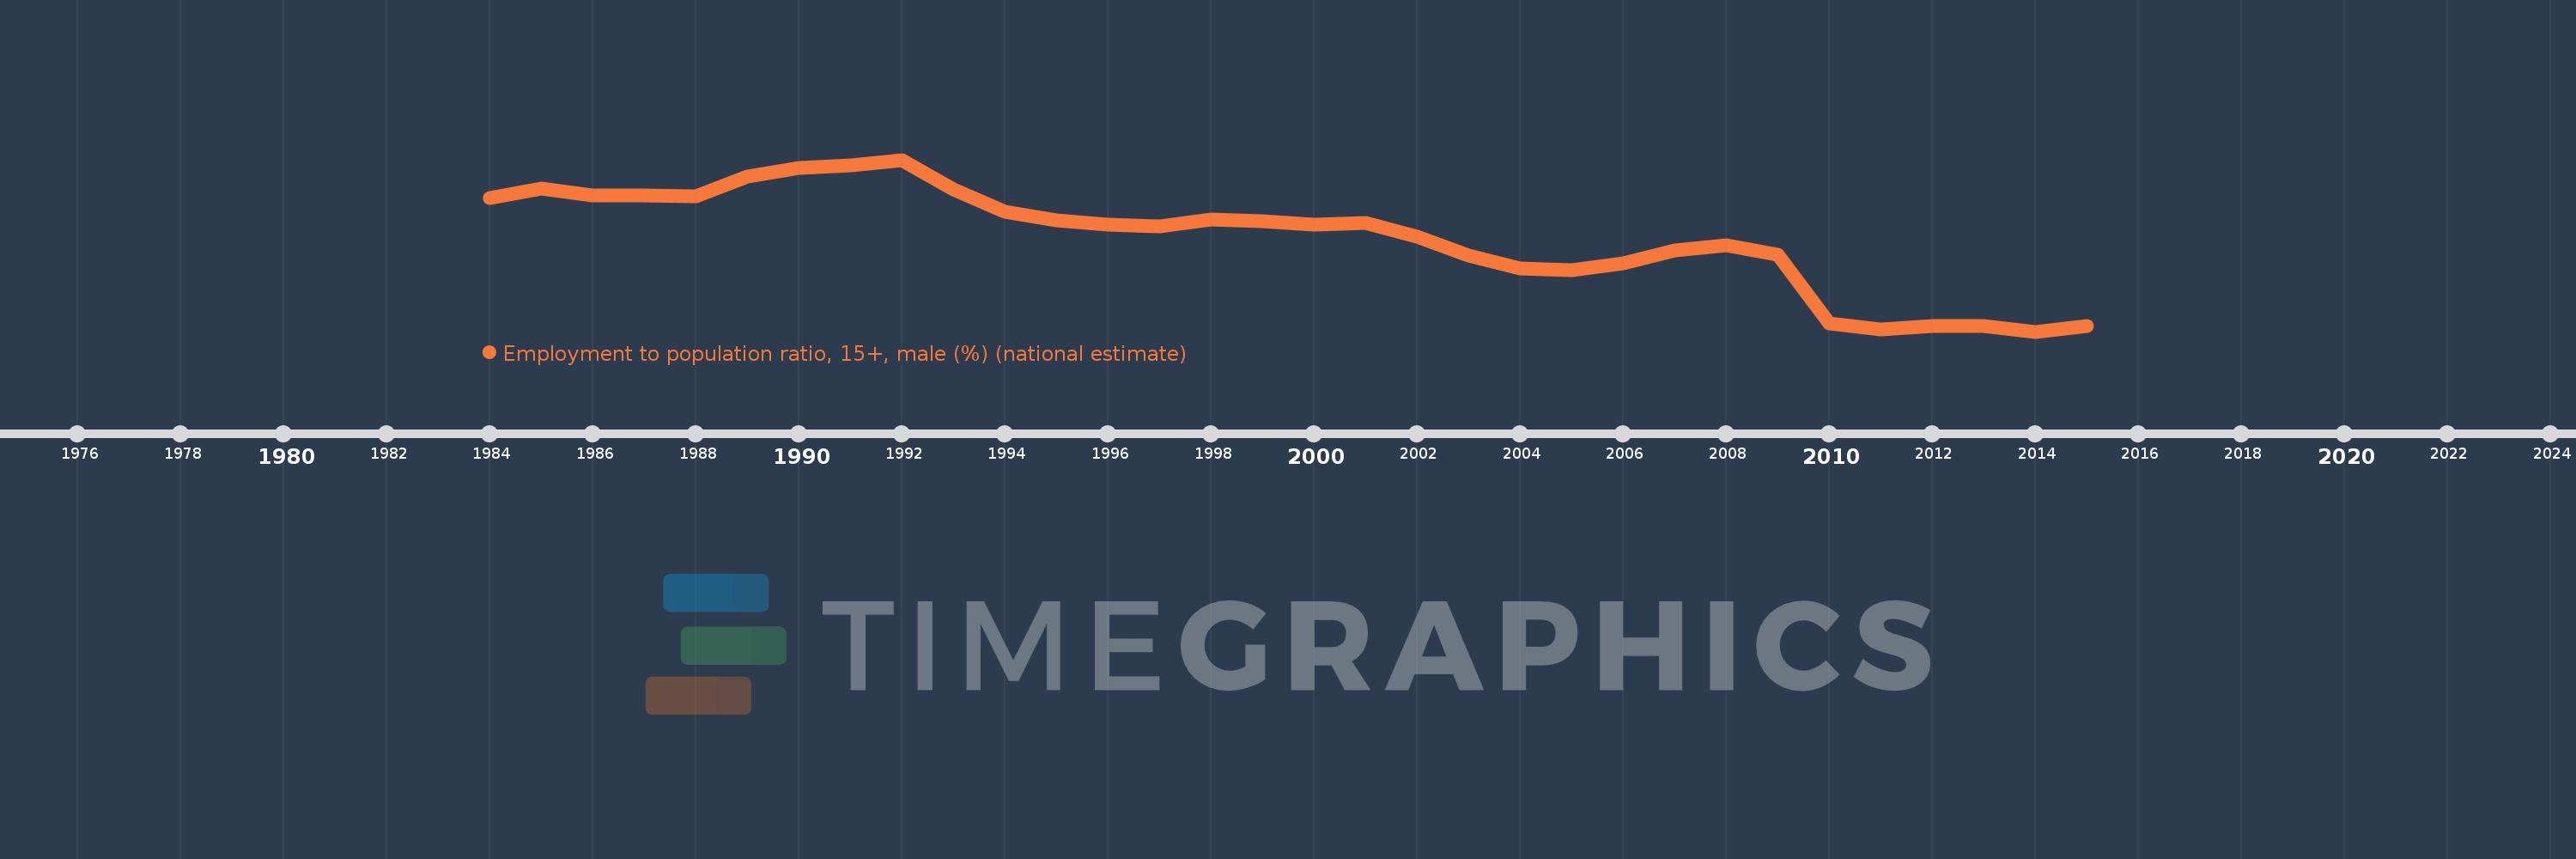
Employment to population ratio, 15+, male (%) (national estimate)
2015,2014,2013,2012,2011,2010,2009,2008,2007,2006,2005,2004,2003,2002,2001,2000,1999,1998,1997,1996,1995,1994,1993,1992,1991,1990,1989,1988,1987,1986,1985,1984
Cette statistique dans les autres pays:
AfghanistanAlbaniaAlgeriaAmerican SamoaAntigua and BarbudaArab WorldArgentinaArmeniaArubaAustraliaAustriaAzerbaijanBahamas, TheBahrainBangladeshBarbadosBelarusBelgiumBelizeBeninBermudaBhutanBoliviaBosnia and HerzegovinaBotswanaBrazilBritish Virgin IslandsBrunei DarussalamBulgariaBurkina FasoBurundiCambodiaCameroonCanadaCaribbean small statesCayman IslandsCentral Europe and the BalticsChadChileColombiaCongo, Dem. Rep.Congo, Rep.Costa RicaCroatiaCubaCyprusCzech RepublicDenmarkDjiboutiDominicaDominican RepublicEarly-demographic dividendEcuadorEgypt, Arab Rep.El SalvadorEstoniaEthiopiaEuro areaEurope & Central AsiaEurope & Central Asia (excluding high income)Europe & Central Asia (IDA & IBRD countries)European UnionFaroe IslandsFijiFinlandFranceFrench PolynesiaGabonGambia, TheGeorgiaGermanyGhanaGreeceGrenadaGuamGuatemalaGuineaGuyanaHaitiHigh incomeHondurasHong Kong SAR, ChinaHungaryIcelandIndiaIndonesiaIran, Islamic Rep.IraqIrelandIsle of ManIsraelItalyJamaicaJapanJordanKazakhstanKenyaKiribatiKorea, Rep.KosovoKuwaitKyrgyz RepublicLao PDRLatin America & Caribbean Latin America & Caribbean (excluding high income)Latin America & the Caribbean (IDA & IBRD countries)LatviaLebanonLesothoLiberiaLibyaLithuaniaLower middle incomeLuxembourgMacao SAR, ChinaMacedonia, FYRMadagascarMalawiMalaysiaMaldivesMaliMaltaMarshall IslandsMauritaniaMauritiusMexicoMiddle East & North AfricaMiddle East & North Africa (excluding high income)Middle East & North Africa (IDA & IBRD countries)MoldovaMonacoMongoliaMontenegroMoroccoMozambiqueNamibiaNepalNetherlandsNew CaledoniaNew ZealandNicaraguaNigerNigeriaNorth AmericaNorthern Mariana IslandsNorwayOECD membersOmanPakistanPanamaParaguayPeruPhilippinesPolandPortugalPost-demographic dividendPuerto RicoQatarRomaniaRussian FederationRwandaSamoaSan MarinoSao Tome and PrincipeSaudi ArabiaSenegalSerbiaSeychellesSierra LeoneSingaporeSlovak RepublicSloveniaSolomon IslandsSouth AfricaSouth AsiaSouth Asia (IDA & IBRD)South SudanSpainSri LankaSt. Kitts and NevisSt. LuciaSudanSurinameSwazilandSwedenSwitzerlandSyrian Arab RepublicTajikistanTanzaniaThailandTimor-LesteTogoTongaTrinidad and TobagoTunisiaTurkeyTuvaluUgandaUkraineUnited Arab EmiratesUnited KingdomUnited StatesUruguayVanuatuVenezuela, RBVietnamWest Bank and GazaYemen, Rep.ZambiaZimbabwe La ligne de temps
Cette échelle de temps montre un graphique de 1984 année à 2015 année OECD members. Les données jusqu'à 1983 année ne sont pas présentés. Quantité d'observations actuelles selon dates: 32.
Source (désignation):
Les indicateurs du développement mondiale
Source (organisation):
International Labour Organization, Key Indicators of the Labour Market database.
Catégories:
Social Protection & Labor
Dernière mise à jour
23 avr. 2017
Les indicateurs de changement de valeurs selon les années
Minimum:
63.655
1 janv. 2014
Maximum:
69.78
1 janv. 1992
Pour la date d''observation
Valeur
Changement absolu
Le changement par rapport à la valeur précédente
1 janv. 1984
68.412
+68.412
0.0%
1 janv. 1985
68.74
+0.327
0.48%
1 janv. 1986
68.501
-0.239
-0.35%
1 janv. 1987
68.51
+0.01
0.01%
1 janv. 1988
68.466
-0.044
-0.06%
1 janv. 1989
69.187
+0.721
1.05%
1 janv. 1990
69.496
+0.309
0.45%
1 janv. 1991
69.572
+0.076
0.11%
1 janv. 1992
69.78
+0.208
0.3%
1 janv. 1993
68.725
-1.055
-1.51%
1 janv. 1994
67.942
-0.782
-1.14%
1 janv. 1995
67.625
-0.317
-0.47%
1 janv. 1996
67.475
-0.15
-0.22%
1 janv. 1997
67.405
-0.07
-0.1%
1 janv. 1998
67.646
+0.241
0.36%
1 janv. 1999
67.601
-0.045
-0.07%
1 janv. 2000
67.454
-0.147
-0.22%
1 janv. 2001
67.518
+0.064
0.09%
1 janv. 2002
67.043
-0.476
-0.7%
1 janv. 2003
66.36
-0.683
-1.02%
1 janv. 2004
65.91
-0.449
-0.68%
1 janv. 2005
65.845
-0.065
-0.1%
1 janv. 2006
66.097
+0.252
0.38%
1 janv. 2007
66.563
+0.466
0.71%
1 janv. 2008
66.738
+0.175
0.26%
1 janv. 2009
66.401
-0.337
-0.5%
1 janv. 2010
63.951
-2.45
-3.69%
1 janv. 2011
63.723
-0.228
-0.36%
1 janv. 2012
63.845
+0.122
0.19%
1 janv. 2013
63.852
+0.008
0.01%
1 janv. 2014
63.655
-0.197
-0.31%
1 janv. 2015
63.846
+0.191
0.3%
Classement des pays selon les statistiques actuelles par années


Commentaires: