29
/fr/
fr
AIzaSyAYiBZKx7MnpbEhh9jyipgxe19OcubqV5w
April 1, 2024
52412
OECD members
OED
false
2
1
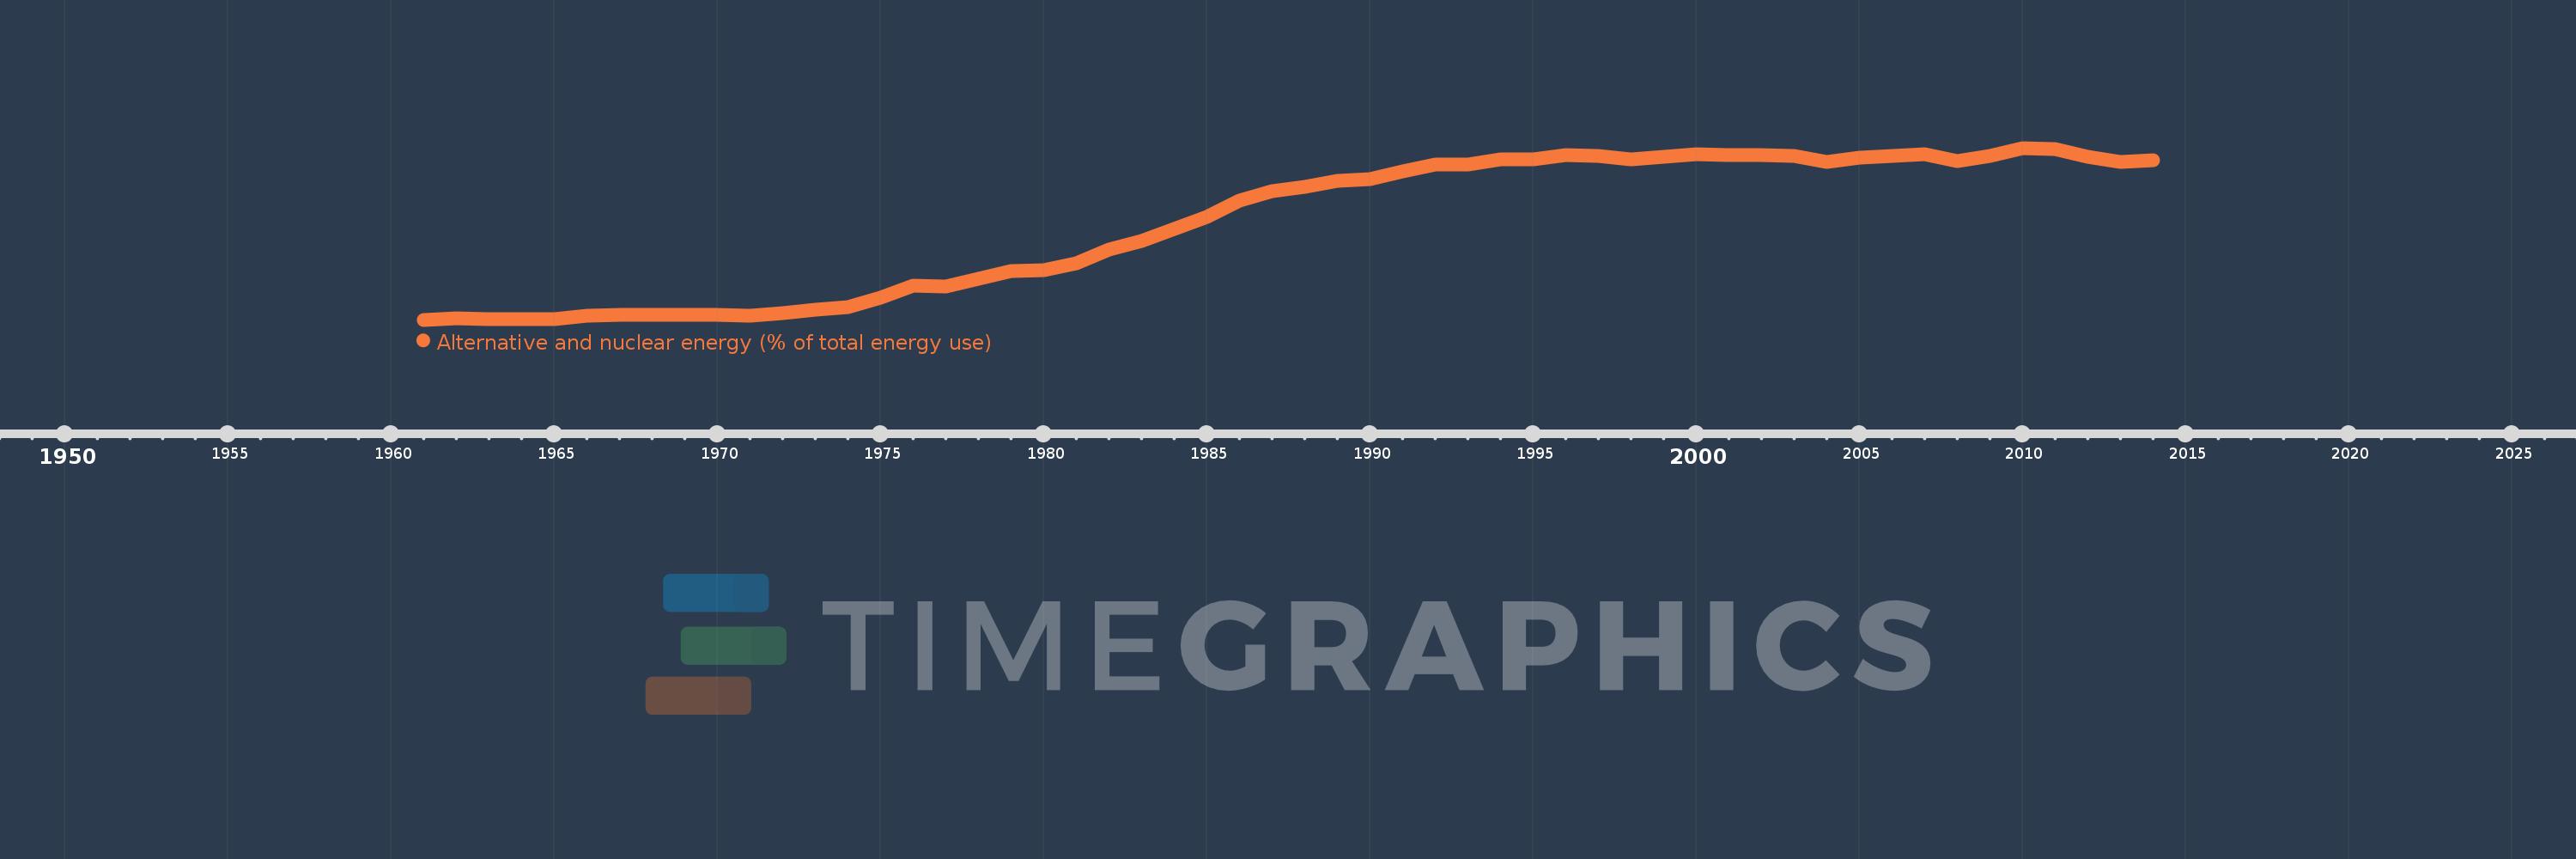
Alternative and nuclear energy (% of total energy use)
2014,2013,2012,2011,2010,2009,2008,2007,2006,2005,2004,2003,2002,2001,2000,1999,1998,1997,1996,1995,1994,1993,1992,1991,1990,1989,1988,1987,1986,1985,1984,1983,1982,1981,1980,1979,1978,1977,1976,1975,1974,1973,1972,1971,1970,1969,1968,1967,1966,1965,1964,1963,1962,1961
Cette statistique dans les autres pays:
AlbaniaAlgeriaAngolaArab WorldArgentinaArmeniaAustraliaAustriaAzerbaijanBahrainBangladeshBelarusBelgiumBeninBoliviaBosnia and HerzegovinaBotswanaBrazilBrunei DarussalamBulgariaCambodiaCameroonCanadaCaribbean small statesCentral Europe and the BalticsChileChinaColombiaCongo, Dem. Rep.Congo, Rep.Costa RicaCote d'IvoireCroatiaCubaCuracaoCyprusCzech RepublicDenmarkDominican RepublicEarly-demographic dividendEast Asia & PacificEast Asia & Pacific (excluding high income)East Asia & Pacific (IDA & IBRD countries)EcuadorEgypt, Arab Rep.El SalvadorEritreaEstoniaEthiopiaEuro areaEurope & Central AsiaEurope & Central Asia (excluding high income)Europe & Central Asia (IDA & IBRD countries)European UnionFinlandFragile and conflict affected situationsFranceGabonGeorgiaGermanyGhanaGibraltarGreeceGuatemalaHaitiHeavily indebted poor countries (HIPC)High incomeHondurasHong Kong SAR, ChinaHungaryIBRD onlyIcelandIDA & IBRD totalIDA blendIDA onlyIDA totalIndiaIndonesiaIran, Islamic Rep.IraqIrelandIsraelItalyJamaicaJapanJordanKazakhstanKenyaKorea, Dem. People’s Rep.Korea, Rep.KosovoKuwaitKyrgyz RepublicLate-demographic dividendLatin America & Caribbean Latin America & Caribbean (excluding high income)Latin America & the Caribbean (IDA & IBRD countries)LatviaLeast developed countries: UN classificationLebanonLibyaLithuaniaLow & middle incomeLow incomeLower middle incomeLuxembourgMacedonia, FYRMalaysiaMaltaMauritiusMexicoMiddle East & North AfricaMiddle East & North Africa (excluding high income)Middle East & North Africa (IDA & IBRD countries)Middle incomeMoldovaMongoliaMontenegroMoroccoMozambiqueMyanmarNamibiaNepalNetherlandsNew ZealandNicaraguaNigerNigeriaNorth AmericaNorwayOECD membersOmanOther small statesPakistanPanamaParaguayPeruPhilippinesPolandPortugalPost-demographic dividendPre-demographic dividendQatarRomaniaRussian FederationSaudi ArabiaSenegalSerbiaSingaporeSlovak RepublicSloveniaSmall statesSouth AfricaSouth AsiaSouth Asia (IDA & IBRD)South SudanSpainSri LankaSub-Saharan Africa Sub-Saharan Africa (excluding high income)Sub-Saharan Africa (IDA & IBRD countries)SudanSwedenSwitzerlandSyrian Arab RepublicTajikistanTanzaniaThailandTogoTrinidad and TobagoTunisiaTurkeyTurkmenistanUkraineUnited Arab EmiratesUnited KingdomUnited StatesUpper middle incomeUruguayUzbekistanVenezuela, RBVietnamWorldYemen, Rep.ZambiaZimbabwe La ligne de temps
Cette échelle de temps montre un graphique de 1961 année à 2014 année OECD members. Les données jusqu'à 1960 année ne sont pas présentés. Quantité d'observations actuelles selon dates: 54.
Source (désignation):
Les indicateurs du développement mondiale
Source (organisation):
IEA Statistics © OECD/IEA 2014 (http://www.iea.org/stats/index.asp), subject to https://www.iea.org/t&c/termsandconditions/
Catégories:
Energy & Mining
Dernière mise à jour
23 avr. 2017
Les indicateurs de changement de valeurs selon les années
Minimum:
2.728
1 janv. 1961
Maximum:
14.448
1 janv. 2010
Pour la date d''observation
Valeur
Changement absolu
Le changement par rapport à la valeur précédente
1 janv. 1961
2.728
+2.728
0.0%
1 janv. 1962
2.801
+0.073
2.67%
1 janv. 1963
2.765
-0.036
-1.28%
1 janv. 1964
2.773
+0.009
0.31%
1 janv. 1965
2.779
+0.006
0.2%
1 janv. 1966
2.982
+0.203
7.31%
1 janv. 1967
3.075
+0.093
3.12%
1 janv. 1968
3.054
-0.02
-0.67%
1 janv. 1969
3.052
-0.002
-0.08%
1 janv. 1970
3.066
+0.015
0.48%
1 janv. 1971
2.986
-0.08
-2.62%
1 janv. 1972
3.169
+0.182
6.11%
1 janv. 1973
3.422
+0.253
7.99%
1 janv. 1974
3.59
+0.168
4.92%
1 janv. 1975
4.251
+0.661
18.42%
1 janv. 1976
5.043
+0.792
18.63%
1 janv. 1977
5.004
-0.039
-0.78%
1 janv. 1978
5.525
+0.521
10.41%
1 janv. 1979
6.034
+0.509
9.22%
1 janv. 1980
6.116
+0.081
1.35%
1 janv. 1981
6.551
+0.435
7.11%
1 janv. 1982
7.505
+0.954
14.56%
1 janv. 1983
8.118
+0.613
8.17%
1 janv. 1984
8.917
+0.799
9.85%
1 janv. 1985
9.744
+0.827
9.28%
1 janv. 1986
10.841
+1.097
11.25%
1 janv. 1987
11.525
+0.684
6.31%
1 janv. 1988
11.789
+0.264
2.29%
1 janv. 1989
12.178
+0.389
3.3%
1 janv. 1990
12.327
+0.148
1.22%
1 janv. 1991
12.846
+0.52
4.22%
1 janv. 1992
13.295
+0.449
3.49%
1 janv. 1993
13.307
+0.012
0.09%
1 janv. 1994
13.647
+0.339
2.55%
1 janv. 1995
13.687
+0.04
0.29%
1 janv. 1996
13.952
+0.266
1.94%
1 janv. 1997
13.925
-0.027
-0.19%
1 janv. 1998
13.65
-0.275
-1.98%
1 janv. 1999
13.854
+0.204
1.49%
1 janv. 2000
14.019
+0.165
1.19%
1 janv. 2001
13.948
-0.071
-0.51%
1 janv. 2002
13.977
+0.029
0.21%
1 janv. 2003
13.91
-0.067
-0.48%
1 janv. 2004
13.49
-0.421
-3.02%
1 janv. 2005
13.775
+0.285
2.11%
1 janv. 2006
13.881
+0.106
0.77%
1 janv. 2007
13.998
+0.118
0.85%
1 janv. 2008
13.565
-0.434
-3.1%
1 janv. 2009
13.894
+0.33
2.43%
1 janv. 2010
14.448
+0.553
3.98%
1 janv. 2011
14.353
-0.095
-0.66%
1 janv. 2012
13.86
-0.492
-3.43%
1 janv. 2013
13.485
-0.376
-2.71%
1 janv. 2014
13.59
+0.105
0.78%
Classement des pays selon les statistiques actuelles par années


Commentaires: