29
/fr/
fr
AIzaSyAYiBZKx7MnpbEhh9jyipgxe19OcubqV5w
April 1, 2024
50783
Middle income
MIC
false
2
1
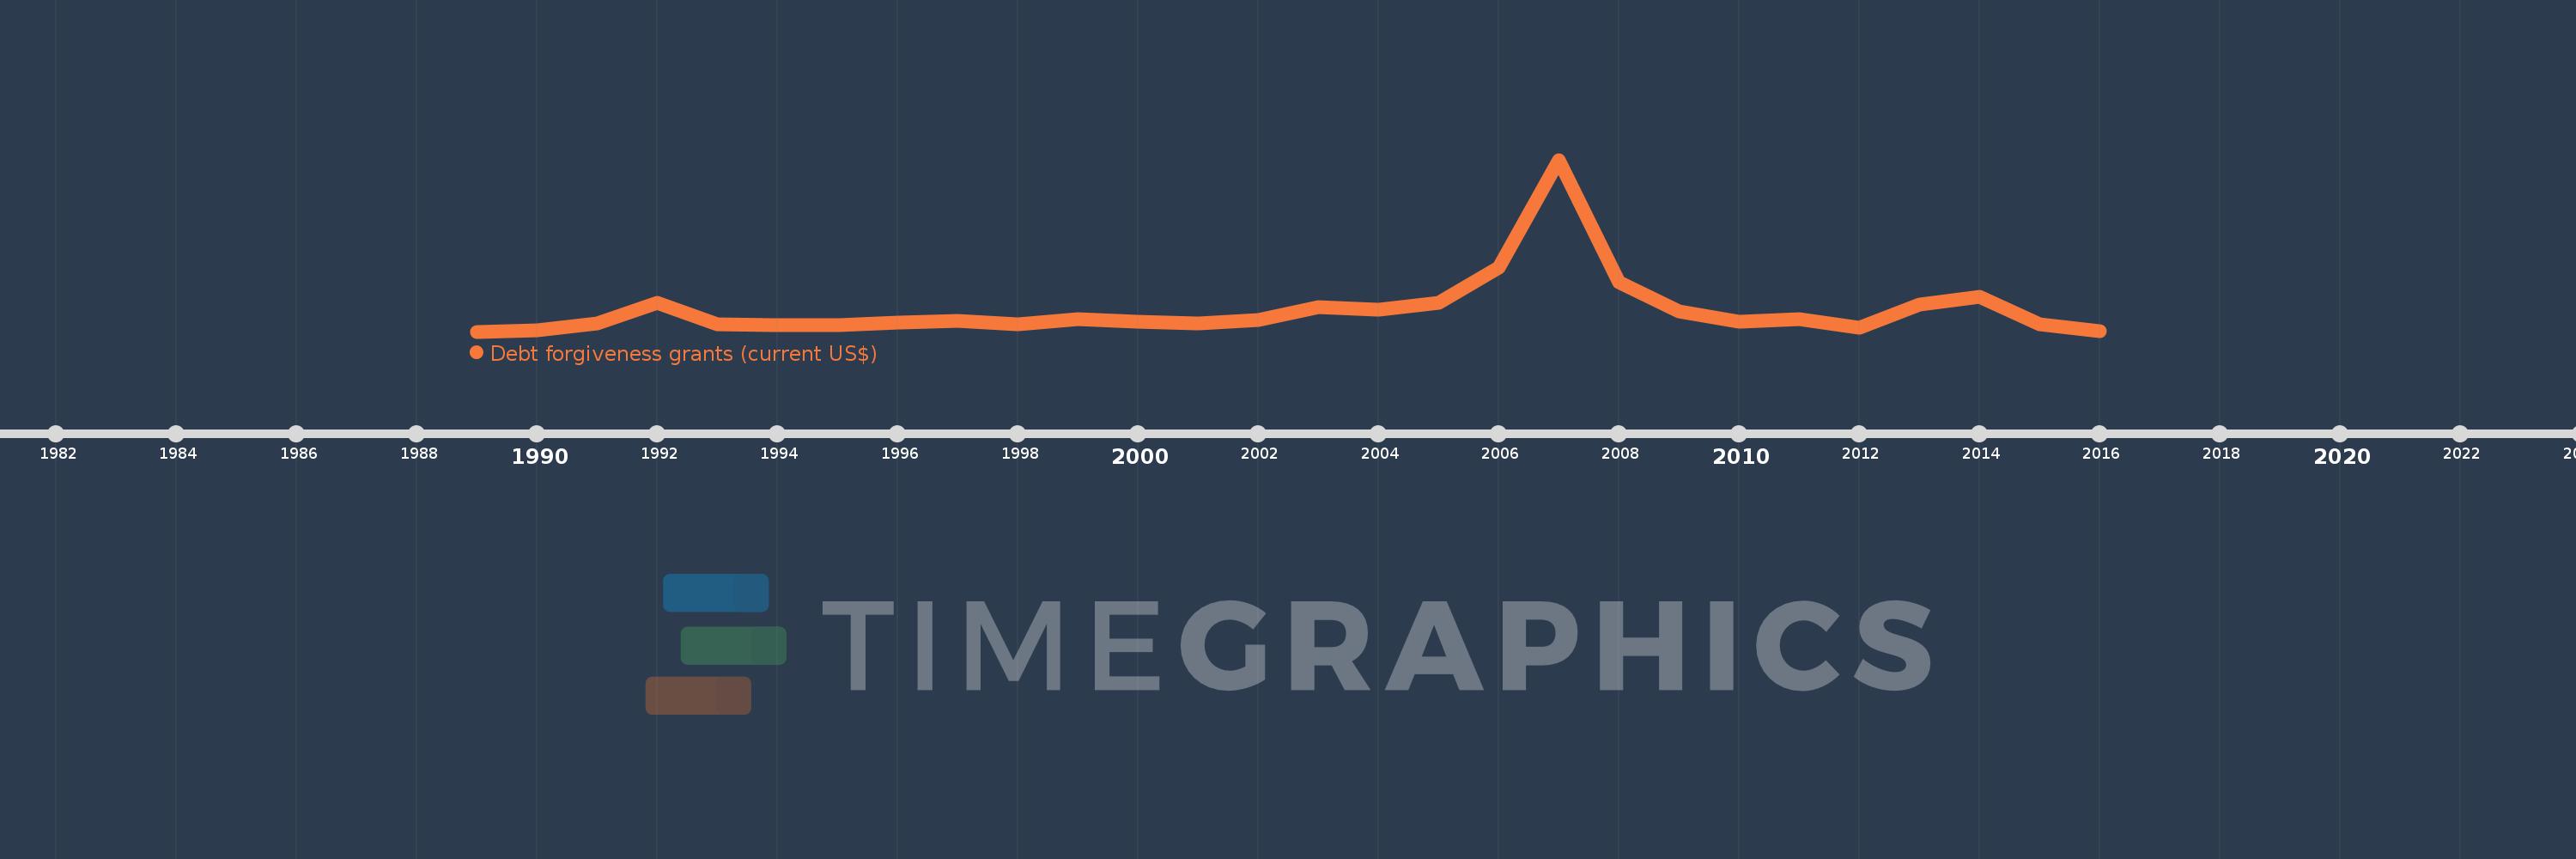
Debt forgiveness grants (current US$)
2016,2015,2014,2013,2012,2011,2010,2009,2008,2007,2006,2005,2004,2003,2002,2001,2000,1999,1998,1997,1996,1995,1994,1993,1992,1991,1990,1989
Cette statistique dans les autres pays:
La ligne de temps
Cette échelle de temps montre un graphique de 1989 année à 2016 année Middle income. Les données jusqu'à 1988 année ne sont pas présentés. Quantité d'observations actuelles selon dates: 28.
Source (désignation):
Les indicateurs du développement mondiale
Source (organisation):
Development Assistance Committee of the Organisation for Economic Co-operation and Development.
Catégories:
Aid Effectiveness, External Debt
Dernière mise à jour
23 avr. 2017
Les indicateurs de changement de valeurs selon les années
Minimum:
-13.66 mln.
1 janv. 1989
Maximum:
24.868 mds
1 janv. 2007
Pour la date d''observation
Valeur
Changement absolu
Le changement par rapport à la valeur précédente
1 janv. 1989
-13.66 mln.
-13.66 mln.
0.0%
1 janv. 1990
117.69 mln.
+131.35 mln.
-961.57%
1 janv. 1991
1.158 mds
+1.04 mds
883.93%
1 janv. 1992
4.133 mds
+2.975 mds
256.93%
1 janv. 1993
1.052 mds
-3.082 mds
-74.56%
1 janv. 1994
861.45 mln.
-190.16 mln.
-18.08%
1 janv. 1995
974.52 mln.
+113.07 mln.
13.13%
1 janv. 1996
1.255 mds
+280.71 mln.
28.8%
1 janv. 1997
1.512 mds
+256.69 mln.
20.45%
1 janv. 1998
1.087 mds
-424.85 mln.
-28.1%
1 janv. 1999
1.837 mds
+750.0 mln.
68.99%
1 janv. 2000
1.459 mds
-377.81 mln.
-20.57%
1 janv. 2001
1.17 mds
-289.74 mln.
-19.86%
1 janv. 2002
1.662 mds
+492.74 mln.
42.13%
1 janv. 2003
3.515 mds
+1.853 mds
111.45%
1 janv. 2004
3.177 mds
-338.09 mln.
-9.62%
1 janv. 2005
4.152 mds
+974.77 mln.
30.68%
1 janv. 2006
9.233 mds
+5.082 mds
122.4%
1 janv. 2007
24.868 mds
+15.635 mds
169.33%
1 janv. 2008
7.182 mds
-17.686 mds
-71.12%
1 janv. 2009
2.871 mds
-4.311 mds
-60.02%
1 janv. 2010
1.404 mds
-1.467 mds
-51.09%
1 janv. 2011
1.849 mds
+445.04 mln.
31.69%
1 janv. 2012
536.13 mln.
-1.313 mds
-71.01%
1 janv. 2013
3.881 mds
+3.345 mds
623.9%
1 janv. 2014
5.063 mds
+1.182 mds
30.44%
1 janv. 2015
987.95 mln.
-4.075 mds
-80.49%
1 janv. 2016
68.79 mln.
-919.16 mln.
-93.04%
Classement des pays selon les statistiques actuelles par années


Commentaires: