29
/fr/
fr
AIzaSyAYiBZKx7MnpbEhh9jyipgxe19OcubqV5w
April 1, 2024
49601
Middle East & North Africa (excluding high income)
MNA
false
2
1
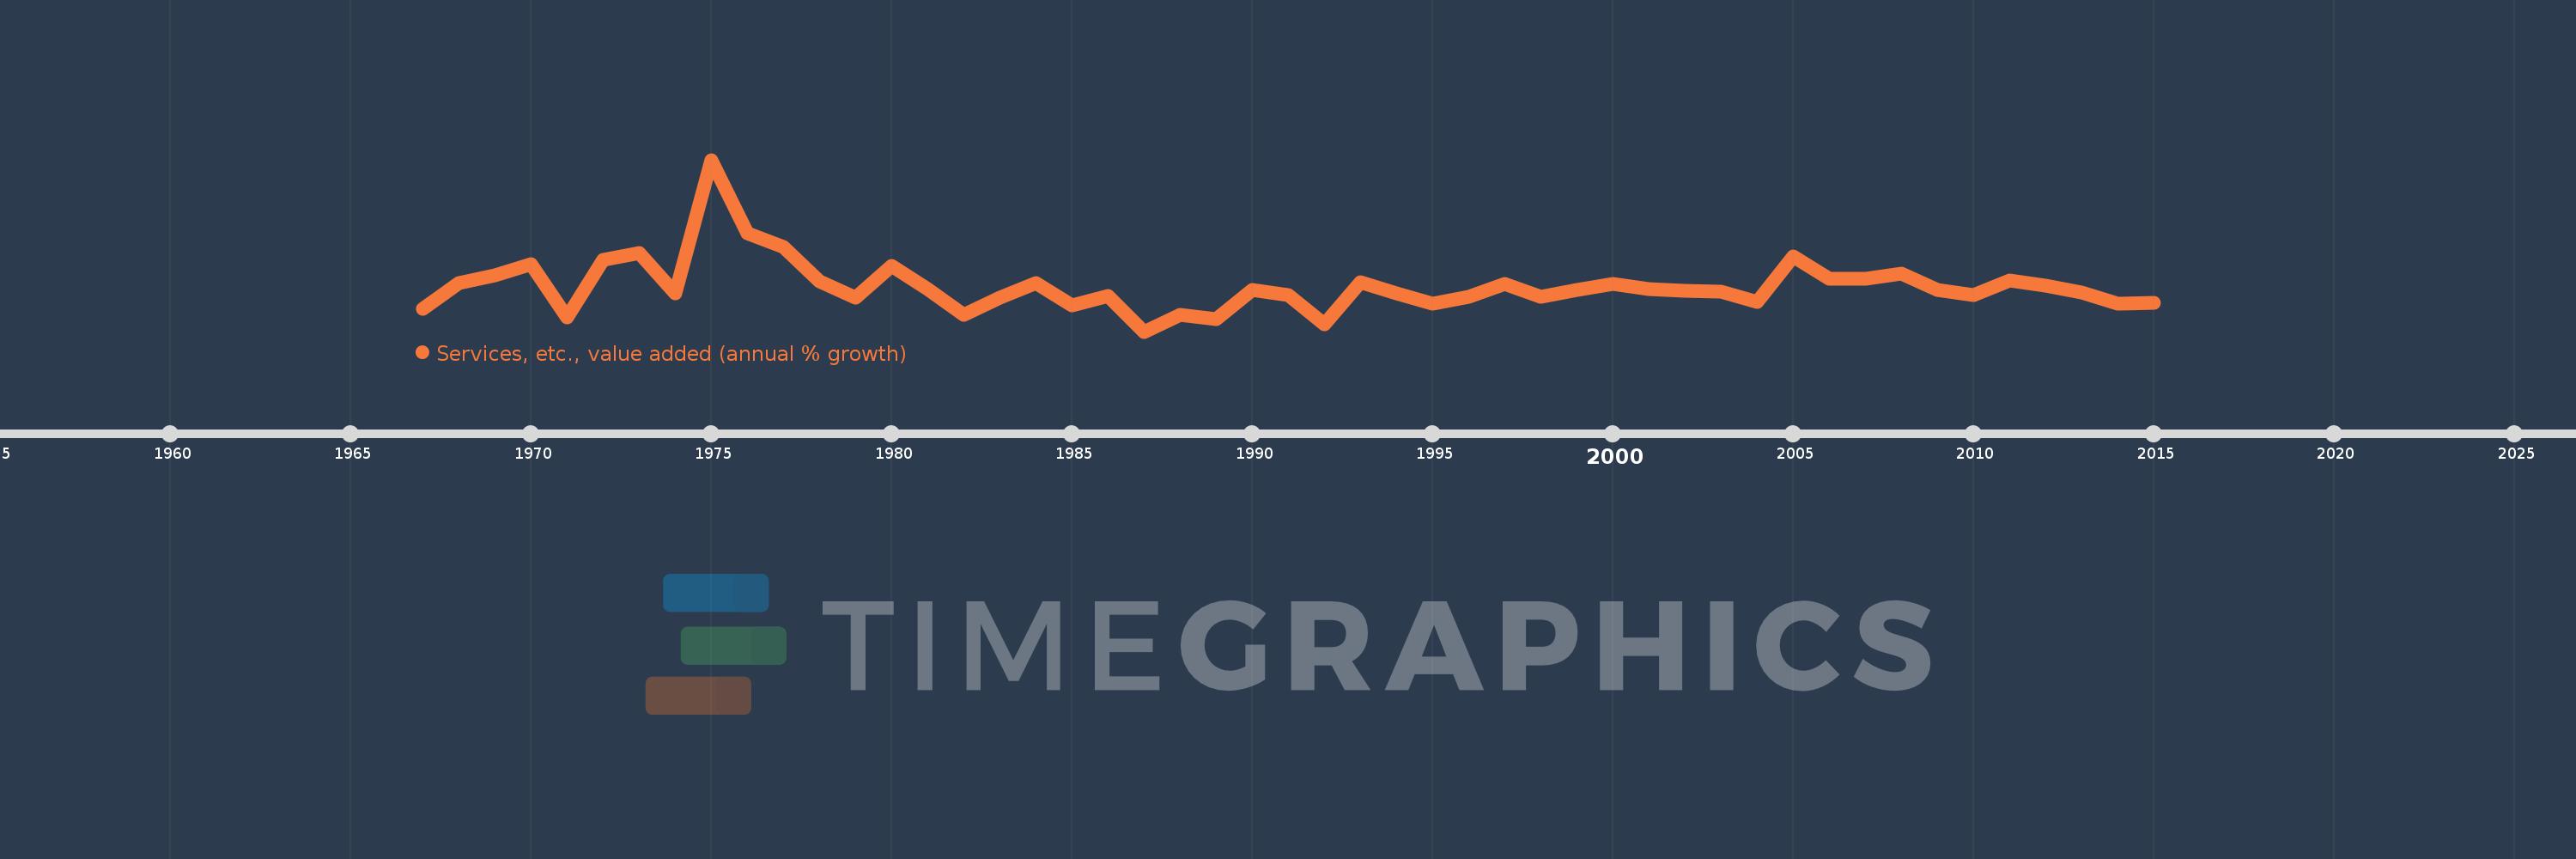
Services, etc., value added (annual % growth)
2015,2014,2013,2012,2011,2010,2009,2008,2007,2006,2005,2004,2003,2002,2001,2000,1999,1998,1997,1996,1995,1994,1993,1992,1991,1990,1989,1988,1987,1986,1985,1984,1983,1982,1981,1980,1979,1978,1977,1976,1975,1974,1973,1972,1971,1970,1969,1968,1967
Cette statistique dans les autres pays:
AfghanistanAlbaniaAlgeriaAntigua and BarbudaArab WorldArgentinaArmeniaAustraliaAustriaAzerbaijanBahamas, TheBahrainBangladeshBelarusBelgiumBelizeBeninBermudaBhutanBoliviaBosnia and HerzegovinaBotswanaBrazilBrunei DarussalamBulgariaBurkina FasoBurundiCabo VerdeCambodiaCameroonCanadaCaribbean small statesCentral African RepublicCentral Europe and the BalticsChadChileChinaColombiaComorosCongo, Dem. Rep.Congo, Rep.Costa RicaCote d'IvoireCroatiaCubaCyprusCzech RepublicDenmarkDjiboutiDominicaDominican RepublicEarly-demographic dividendEast Asia & PacificEast Asia & Pacific (excluding high income)East Asia & Pacific (IDA & IBRD countries)EcuadorEgypt, Arab Rep.El SalvadorEquatorial GuineaEritreaEstoniaEthiopiaEuro areaEurope & Central AsiaEurope & Central Asia (excluding high income)Europe & Central Asia (IDA & IBRD countries)European UnionFijiFinlandFragile and conflict affected situationsFranceGabonGambia, TheGeorgiaGermanyGhanaGreeceGrenadaGuatemalaGuineaGuinea-BissauGuyanaHaitiHeavily indebted poor countries (HIPC)High incomeHondurasHong Kong SAR, ChinaHungaryIBRD onlyIcelandIDA & IBRD totalIDA blendIDA onlyIDA totalIndiaIndonesiaIran, Islamic Rep.IraqIrelandItalyJamaicaJapanJordanKazakhstanKenyaKiribatiKorea, Rep.KosovoKuwaitKyrgyz RepublicLao PDRLate-demographic dividendLatin America & Caribbean Latin America & Caribbean (excluding high income)Latin America & the Caribbean (IDA & IBRD countries)LatviaLeast developed countries: UN classificationLebanonLesothoLiberiaLithuaniaLow & middle incomeLow incomeLower middle incomeLuxembourgMacedonia, FYRMadagascarMalawiMalaysiaMaldivesMaliMarshall IslandsMauritaniaMauritiusMexicoMicronesia, Fed. Sts.Middle East & North AfricaMiddle East & North Africa (excluding high income)Middle East & North Africa (IDA & IBRD countries)Middle incomeMoldovaMongoliaMontenegroMoroccoMozambiqueMyanmarNamibiaNepalNetherlandsNew ZealandNicaraguaNigerNigeriaNorth AmericaNorwayOECD membersOmanOther small statesPacific island small statesPakistanPalauPanamaPapua New GuineaParaguayPeruPhilippinesPolandPortugalPost-demographic dividendPre-demographic dividendPuerto RicoQatarRomaniaRussian FederationRwandaSamoaSao Tome and PrincipeSaudi ArabiaSenegalSerbiaSeychellesSierra LeoneSingaporeSlovak RepublicSloveniaSmall statesSolomon IslandsSomaliaSouth AfricaSouth AsiaSouth Asia (IDA & IBRD)SpainSri LankaSt. Kitts and NevisSt. LuciaSt. Vincent and the GrenadinesSub-Saharan Africa Sub-Saharan Africa (excluding high income)Sub-Saharan Africa (IDA & IBRD countries)SudanSurinameSwazilandSwedenSwitzerlandSyrian Arab RepublicTajikistanTanzaniaThailandTimor-LesteTogoTongaTrinidad and TobagoTunisiaTurkeyTurkmenistanTuvaluUgandaUkraineUnited Arab EmiratesUnited KingdomUnited StatesUpper middle incomeUruguayUzbekistanVanuatuVenezuela, RBVietnamWest Bank and GazaWorldZambiaZimbabwe La ligne de temps
Cette échelle de temps montre un graphique de 1967 année à 2015 année Middle East & North Africa (excluding high income). Les données jusqu'à 1966 année ne sont pas présentés. Quantité d'observations actuelles selon dates: 49.
Source (désignation):
Les indicateurs du développement mondiale
Source (organisation):
World Bank national accounts data, and OECD National Accounts data files.
Catégories:
Economy & Growth
Dernière mise à jour
23 avr. 2017
Les indicateurs de changement de valeurs selon les années
Minimum:
-4.293
1 janv. 1987
Maximum:
31.954
1 janv. 1975
Pour la date d''observation
Valeur
Changement absolu
Le changement par rapport à la valeur précédente
1 janv. 1967
0.551
+0.551
0.0%
1 janv. 1968
5.903
+5.352
971.92%
1 janv. 1969
7.577
+1.674
28.36%
1 janv. 1970
9.899
+2.322
30.65%
1 janv. 1971
-1.322
-11.22
-113.35%
1 janv. 1972
10.784
+12.106
-915.78%
1 janv. 1973
12.287
+1.504
13.94%
1 janv. 1974
3.736
-8.552
-69.6%
1 janv. 1975
31.954
+28.218
755.35%
1 janv. 1976
16.483
-15.471
-48.42%
1 janv. 1977
13.569
-2.914
-17.68%
1 janv. 1978
6.287
-7.282
-53.67%
1 janv. 1979
2.891
-3.396
-54.02%
1 janv. 1980
9.621
+6.73
232.82%
1 janv. 1981
4.647
-4.974
-51.7%
1 janv. 1982
-0.775
-5.422
-116.69%
1 janv. 1983
2.843
+3.618
-466.63%
1 janv. 1984
5.859
+3.016
106.1%
1 janv. 1985
1.18
-4.679
-79.85%
1 janv. 1986
3.271
+2.09
177.09%
1 janv. 1987
-4.293
-7.564
-231.25%
1 janv. 1988
-0.722
+3.57
-83.17%
1 janv. 1989
-1.579
-0.856
118.55%
1 janv. 1990
4.494
+6.072
-384.61%
1 janv. 1991
3.332
-1.162
-25.86%
1 janv. 1992
-2.827
-6.159
-184.85%
1 janv. 1993
6.106
+8.933
-316.0%
1 janv. 1994
3.768
-2.339
-38.3%
1 janv. 1995
1.65
-2.118
-56.21%
1 janv. 1996
3.048
+1.398
84.72%
1 janv. 1997
5.712
+2.664
87.43%
1 janv. 1998
2.994
-2.718
-47.58%
1 janv. 1999
4.422
+1.428
47.71%
1 janv. 2000
5.694
+1.272
28.76%
1 janv. 2001
4.756
-0.938
-16.48%
1 janv. 2002
4.346
-0.41
-8.62%
1 janv. 2003
4.162
-0.183
-4.22%
1 janv. 2004
1.965
-2.198
-52.8%
1 janv. 2005
11.478
+9.513
484.23%
1 janv. 2006
6.815
-4.662
-40.62%
1 janv. 2007
6.775
-0.041
-0.6%
1 janv. 2008
8.025
+1.25
18.46%
1 janv. 2009
4.577
-3.448
-42.96%
1 janv. 2010
3.334
-1.243
-27.17%
1 janv. 2011
6.503
+3.169
95.06%
1 janv. 2012
5.328
-1.175
-18.07%
1 janv. 2013
3.998
-1.329
-24.95%
1 janv. 2014
1.538
-2.46
-61.54%
1 janv. 2015
1.839
+0.301
19.6%
Classement des pays selon les statistiques actuelles par années


Commentaires: