29
/fr/
fr
AIzaSyAYiBZKx7MnpbEhh9jyipgxe19OcubqV5w
April 1, 2024
49223
Middle East & North Africa (excluding high income)
MNA
false
2
1
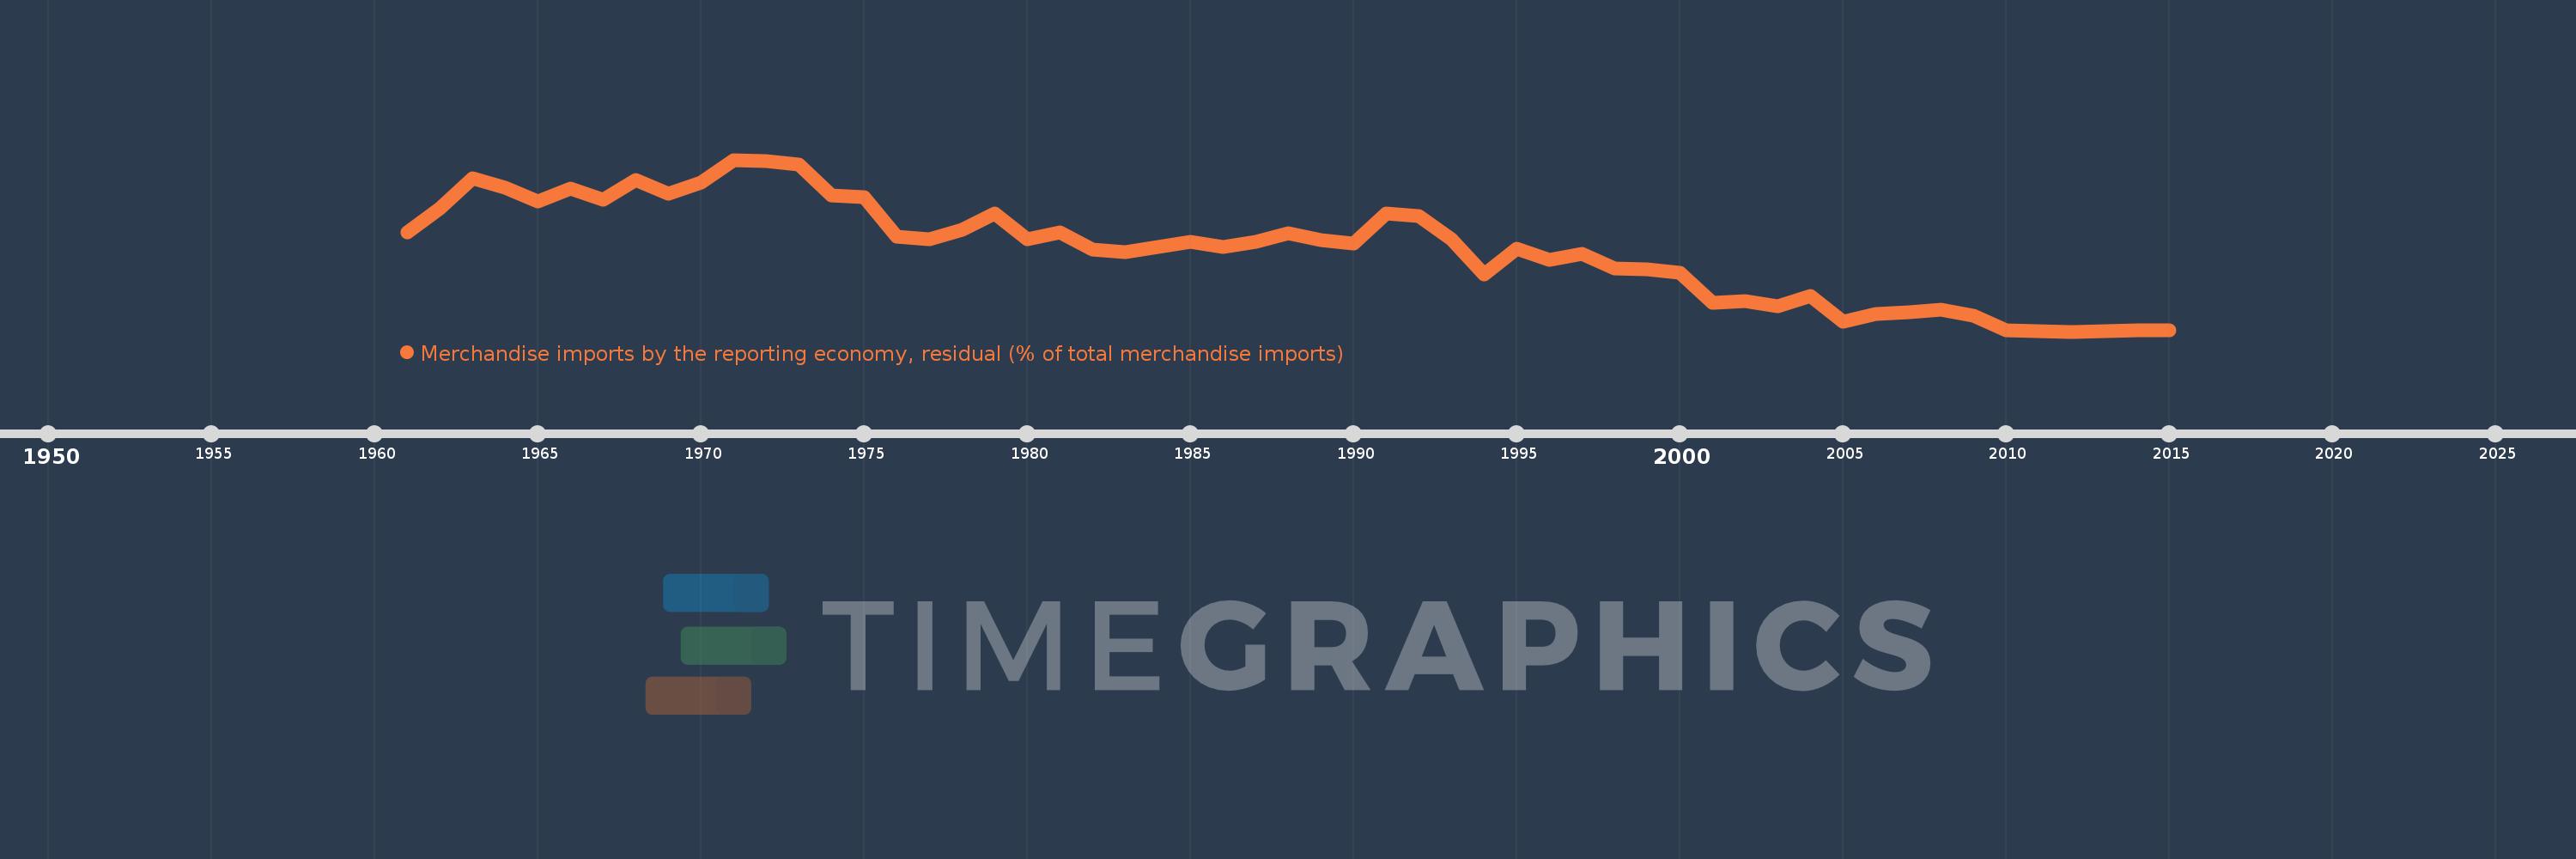
Merchandise imports by the reporting economy, residual (% of total merchandise imports)
2015,2014,2013,2012,2011,2010,2009,2008,2007,2006,2005,2004,2003,2002,2001,2000,1999,1998,1997,1996,1995,1994,1993,1992,1991,1990,1989,1988,1987,1986,1985,1984,1983,1982,1981,1980,1979,1978,1977,1976,1975,1974,1973,1972,1971,1970,1969,1968,1967,1966,1965,1964,1963,1962,1961
Cette statistique dans les autres pays:
AfghanistanAlbaniaAlgeriaAmerican SamoaAngolaAntigua and BarbudaArab WorldArgentinaArmeniaArubaAustraliaAustriaAzerbaijanBahamas, TheBahrainBangladeshBarbadosBelarusBelgiumBelizeBeninBermudaBoliviaBosnia and HerzegovinaBrazilBrunei DarussalamBulgariaBurkina FasoBurundiCabo VerdeCambodiaCameroonCanadaCaribbean small statesCentral African RepublicCentral Europe and the BalticsChadChileChinaColombiaComorosCongo, Dem. Rep.Congo, Rep.Costa RicaCote d'IvoireCroatiaCubaCyprusCzech RepublicDenmarkDjiboutiDominicaDominican RepublicEarly-demographic dividendEast Asia & PacificEast Asia & Pacific (excluding high income)East Asia & Pacific (IDA & IBRD countries)EcuadorEgypt, Arab Rep.El SalvadorEquatorial GuineaEstoniaEthiopiaEuro areaEurope & Central AsiaEurope & Central Asia (excluding high income)Europe & Central Asia (IDA & IBRD countries)European UnionFaroe IslandsFijiFinlandFragile and conflict affected situationsFranceFrench PolynesiaGabonGambia, TheGeorgiaGermanyGhanaGibraltarGreeceGreenlandGrenadaGuamGuatemalaGuineaGuinea-BissauGuyanaHaitiHeavily indebted poor countries (HIPC)High incomeHondurasHong Kong SAR, ChinaHungaryIBRD onlyIcelandIDA & IBRD totalIDA blendIDA onlyIDA totalIndiaIndonesiaIran, Islamic Rep.IraqIrelandIsraelItalyJamaicaJapanJordanKazakhstanKenyaKiribatiKorea, Dem. People’s Rep.Korea, Rep.KosovoKuwaitKyrgyz RepublicLao PDRLate-demographic dividendLatin America & Caribbean Latin America & Caribbean (excluding high income)Latin America & the Caribbean (IDA & IBRD countries)LatviaLeast developed countries: UN classificationLebanonLiberiaLibyaLithuaniaLow & middle incomeLow incomeLower middle incomeLuxembourgMacao SAR, ChinaMacedonia, FYRMadagascarMalawiMalaysiaMaldivesMaliMaltaMauritaniaMauritiusMexicoMiddle East & North AfricaMiddle East & North Africa (excluding high income)Middle East & North Africa (IDA & IBRD countries)Middle incomeMoldovaMongoliaMontenegroMoroccoMozambiqueMyanmarNauruNepalNetherlandsNew CaledoniaNew ZealandNicaraguaNigerNigeriaNorth AmericaNorwayOECD membersOmanOther small statesPacific island small statesPakistanPanamaPapua New GuineaParaguayPeruPhilippinesPolandPortugalPost-demographic dividendPre-demographic dividendQatarRomaniaRussian FederationRwandaSamoaSao Tome and PrincipeSaudi ArabiaSenegalSerbiaSeychellesSierra LeoneSingaporeSlovak RepublicSloveniaSmall statesSolomon IslandsSomaliaSouth AfricaSouth AsiaSouth Asia (IDA & IBRD)SpainSri LankaSt. Kitts and NevisSt. LuciaSt. Vincent and the GrenadinesSub-Saharan Africa Sub-Saharan Africa (excluding high income)Sub-Saharan Africa (IDA & IBRD countries)SudanSurinameSwedenSwitzerlandSyrian Arab RepublicTajikistanTanzaniaThailandTogoTongaTrinidad and TobagoTunisiaTurkeyTurkmenistanTuvaluUgandaUkraineUnited Arab EmiratesUnited KingdomUnited StatesUpper middle incomeUruguayUzbekistanVanuatuVenezuela, RBVietnamWorldYemen, Rep.ZambiaZimbabwe La ligne de temps
Cette échelle de temps montre un graphique de 1961 année à 2015 année Middle East & North Africa (excluding high income). Les données jusqu'à 1960 année ne sont pas présentés. Quantité d'observations actuelles selon dates: 55.
Source (désignation):
Les indicateurs du développement mondiale
Source (organisation):
World Bank staff estimates based data from International Monetary Fund's Direction of Trade database.
Catégories:
Private Sector, Trade
Dernière mise à jour
23 avr. 2017
Les indicateurs de changement de valeurs selon les années
Minimum:
0.954
1 janv. 2012
Maximum:
17.809
1 janv. 1971
Pour la date d''observation
Valeur
Changement absolu
Le changement par rapport à la valeur précédente
1 janv. 1961
10.697
+10.697
0.0%
1 janv. 1962
13.041
+2.344
21.91%
1 janv. 1963
16.019
+2.978
22.84%
1 janv. 1964
15.032
-0.986
-6.16%
1 janv. 1965
13.718
-1.314
-8.74%
1 janv. 1966
14.97
+1.252
9.13%
1 janv. 1967
13.92
-1.05
-7.01%
1 janv. 1968
15.819
+1.899
13.64%
1 janv. 1969
14.475
-1.344
-8.49%
1 janv. 1970
15.587
+1.111
7.68%
1 janv. 1971
17.809
+2.222
14.26%
1 janv. 1972
17.71
-0.099
-0.56%
1 janv. 1973
17.344
-0.365
-2.06%
1 janv. 1974
14.335
-3.01
-17.35%
1 janv. 1975
14.112
-0.222
-1.55%
1 janv. 1976
10.239
-3.873
-27.44%
1 janv. 1977
10.022
-0.217
-2.12%
1 janv. 1978
10.95
+0.928
9.26%
1 janv. 1979
12.519
+1.569
14.33%
1 janv. 1980
9.997
-2.523
-20.15%
1 janv. 1981
10.686
+0.69
6.9%
1 janv. 1982
9.013
-1.674
-15.66%
1 janv. 1983
8.758
-0.254
-2.82%
1 janv. 1984
9.275
+0.517
5.9%
1 janv. 1985
9.792
+0.517
5.58%
1 janv. 1986
9.251
-0.541
-5.53%
1 janv. 1987
9.739
+0.488
5.27%
1 janv. 1988
10.602
+0.863
8.86%
1 janv. 1989
9.967
-0.636
-6.0%
1 janv. 1990
9.609
-0.358
-3.59%
1 janv. 1991
12.506
+2.897
30.14%
1 janv. 1992
12.253
-0.253
-2.02%
1 janv. 1993
10.047
-2.205
-18.0%
1 janv. 1994
6.532
-3.515
-34.99%
1 janv. 1995
9.087
+2.555
39.11%
1 janv. 1996
8.03
-1.057
-11.64%
1 janv. 1997
8.547
+0.517
6.44%
1 janv. 1998
7.178
-1.369
-16.02%
1 janv. 1999
7.098
-0.08
-1.11%
1 janv. 2000
6.721
-0.377
-5.31%
1 janv. 2001
3.765
-2.956
-43.98%
1 janv. 2002
3.984
+0.218
5.8%
1 janv. 2003
3.472
-0.511
-12.84%
1 janv. 2004
4.451
+0.979
28.19%
1 janv. 2005
1.922
-2.529
-56.82%
1 janv. 2006
2.713
+0.791
41.14%
1 janv. 2007
2.844
+0.131
4.83%
1 janv. 2008
3.102
+0.258
9.09%
1 janv. 2009
2.487
-0.615
-19.83%
1 janv. 2010
1.086
-1.4
-56.32%
1 janv. 2011
1.034
-0.052
-4.79%
1 janv. 2012
0.954
-0.08
-7.74%
1 janv. 2013
1.037
+0.083
8.73%
1 janv. 2014
1.07
+0.032
3.1%
1 janv. 2015
1.101
+0.032
2.96%
Classement des pays selon les statistiques actuelles par années


Commentaires: