29
/fr/
fr
AIzaSyAYiBZKx7MnpbEhh9jyipgxe19OcubqV5w
April 1, 2024
48365
Middle East & North Africa
MEA
false
2
1
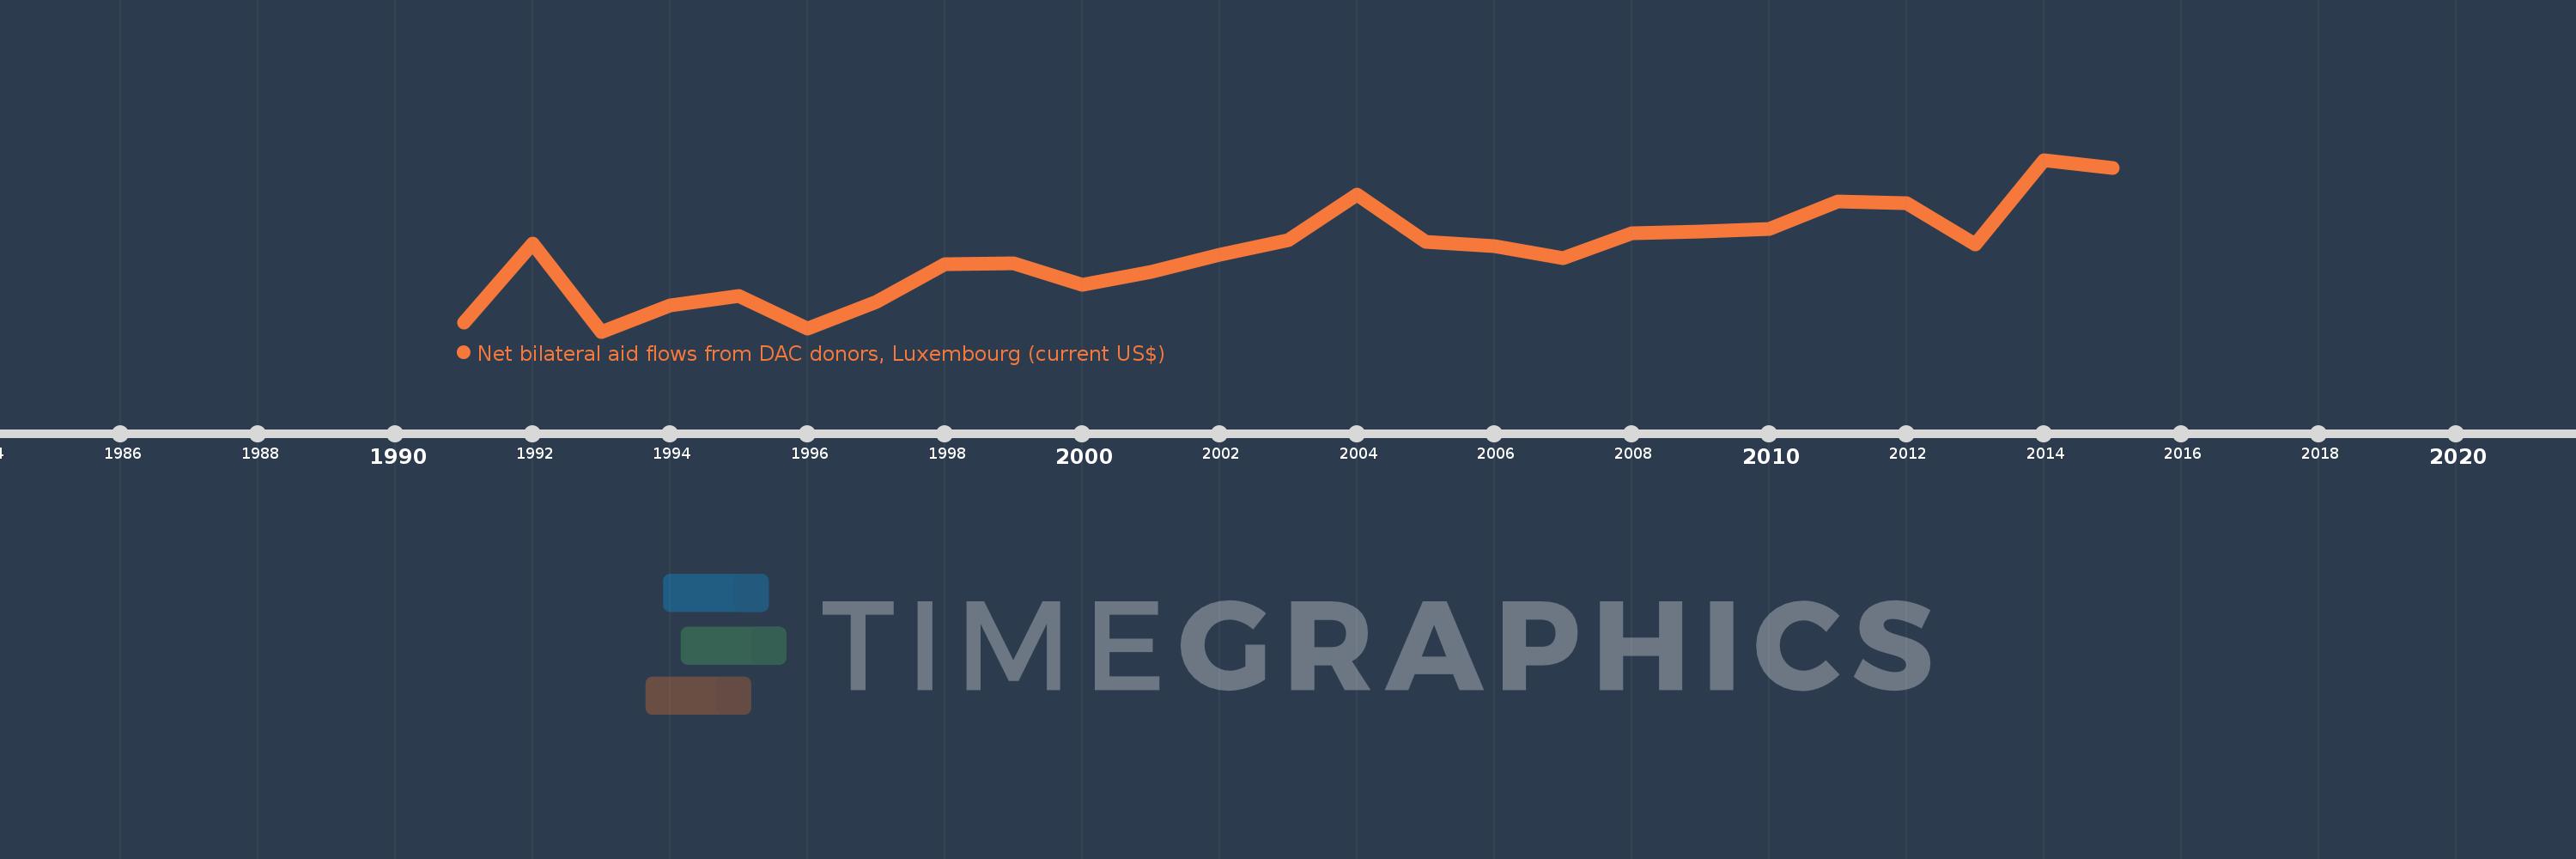
Net bilateral aid flows from DAC donors, Luxembourg (current US$)
2015,2014,2013,2012,2011,2010,2009,2008,2007,2006,2005,2004,2003,2002,2001,2000,1999,1998,1997,1996,1995,1994,1993,1992,1991
Cette statistique dans les autres pays:
AfghanistanAlbaniaAlgeriaAngolaArab WorldArgentinaArmeniaAzerbaijanBangladeshBelarusBelizeBeninBhutanBoliviaBosnia and HerzegovinaBotswanaBrazilBulgariaBurkina FasoBurundiCabo VerdeCambodiaCameroonCaribbean small statesCentral African RepublicCentral Europe and the BalticsChadChileChinaColombiaComorosCongo, Dem. Rep.Congo, Rep.Costa RicaCote d'IvoireCroatiaCubaCzech RepublicDjiboutiDominicaDominican RepublicEast Asia & PacificEast Asia & Pacific (excluding high income)East Asia & Pacific (IDA & IBRD countries)EcuadorEgypt, Arab Rep.El SalvadorEquatorial GuineaEritreaEstoniaEthiopiaEuro areaEurope & Central AsiaEurope & Central Asia (excluding high income)Europe & Central Asia (IDA & IBRD countries)European UnionFijiFragile and conflict affected situationsGabonGambia, TheGeorgiaGhanaGrenadaGuatemalaGuineaGuinea-BissauGuyanaHaitiHeavily indebted poor countries (HIPC)High incomeHondurasHungaryIBRD onlyIDA & IBRD totalIDA blendIDA onlyIDA totalIndiaIndonesiaIran, Islamic Rep.IraqIsraelJamaicaJordanKazakhstanKenyaKorea, Dem. People’s Rep.Korea, Rep.KosovoKyrgyz RepublicLao PDRLatin America & Caribbean Latin America & Caribbean (excluding high income)Latin America & the Caribbean (IDA & IBRD countries)LatviaLeast developed countries: UN classificationLebanonLesothoLiberiaLibyaLithuaniaLow & middle incomeLow incomeLower middle incomeMacedonia, FYRMadagascarMalawiMalaysiaMaldivesMaliMauritaniaMauritiusMexicoMicronesia, Fed. Sts.Middle East & North AfricaMiddle East & North Africa (excluding high income)Middle East & North Africa (IDA & IBRD countries)Middle incomeMoldovaMongoliaMontenegroMoroccoMozambiqueMyanmarNamibiaNepalNicaraguaNigerNigeriaOECD membersOther small statesPacific island small statesPakistanPalauPanamaParaguayPeruPhilippinesPolandRomaniaRussian FederationRwandaSamoaSao Tome and PrincipeSenegalSerbiaSierra LeoneSlovak RepublicSloveniaSmall statesSomaliaSouth AfricaSouth AsiaSouth Asia (IDA & IBRD)South SudanSri LankaSt. LuciaSub-Saharan Africa Sub-Saharan Africa (excluding high income)Sub-Saharan Africa (IDA & IBRD countries)SudanSwazilandSyrian Arab RepublicTajikistanTanzaniaThailandTimor-LesteTogoTunisiaTurkeyTurkmenistanUgandaUkraineUpper middle incomeUruguayUzbekistanVanuatuVenezuela, RBVietnamWest Bank and GazaWorldYemen, Rep.ZambiaZimbabwe La ligne de temps
Cette échelle de temps montre un graphique de 1991 année à 2015 année Middle East & North Africa. Les données jusqu'à 1990 année ne sont pas présentés. Quantité d'observations actuelles selon dates: 25.
Source (désignation):
Les indicateurs du développement mondiale
Source (organisation):
Development Assistance Committee of the Organisation for Economic Co-operation and Development, Geographical Distribution of Financial Flows to Developing Countries, Development Co-operation Report, and International Development Statistics database. Data are available online at: www.oecd.org/dac/stats/idsonline.
Catégories:
Aid Effectiveness
Dernière mise à jour
23 avr. 2017
Les indicateurs de changement de valeurs selon les années
Minimum:
850.0 milles
1 janv. 1993
Maximum:
16.02 mln.
1 janv. 2014
Pour la date d''observation
Valeur
Changement absolu
Le changement par rapport à la valeur précédente
1 janv. 1991
1.61 mln.
+1.61 mln.
0.0%
1 janv. 1992
8.63 mln.
+7.02 mln.
436.02%
1 janv. 1993
850.0 milles
-7.78 mln.
-90.15%
1 janv. 1994
3.14 mln.
+2.29 mln.
269.41%
1 janv. 1995
4.03 mln.
+890.0 milles
28.34%
1 janv. 1996
1.12 mln.
-2.91 mln.
-72.21%
1 janv. 1997
3.48 mln.
+2.36 mln.
210.71%
1 janv. 1998
6.8 mln.
+3.32 mln.
95.4%
1 janv. 1999
6.9 mln.
+100.0 milles
1.47%
1 janv. 2000
5.02 mln.
-1.88 mln.
-27.25%
1 janv. 2001
6.1 mln.
+1.08 mln.
21.51%
1 janv. 2002
7.63 mln.
+1.53 mln.
25.08%
1 janv. 2003
8.92 mln.
+1.29 mln.
16.91%
1 janv. 2004
12.93 mln.
+4.01 mln.
44.96%
1 janv. 2005
8.77 mln.
-4.16 mln.
-32.17%
1 janv. 2006
8.37 mln.
-400.0 milles
-4.56%
1 janv. 2007
7.36 mln.
-1.01 mln.
-12.07%
1 janv. 2008
9.56 mln.
+2.2 mln.
29.89%
1 janv. 2009
9.66 mln.
+100.0 milles
1.05%
1 janv. 2010
9.95 mln.
+290.0 milles
3.0%
1 janv. 2011
12.32 mln.
+2.37 mln.
23.82%
1 janv. 2012
12.19 mln.
-130.0 milles
-1.06%
1 janv. 2013
8.57 mln.
-3.62 mln.
-29.7%
1 janv. 2014
16.02 mln.
+7.45 mln.
86.93%
1 janv. 2015
15.29 mln.
-730.0 milles
-4.56%
Classement des pays selon les statistiques actuelles par années


Commentaires: