29
/fr/
fr
AIzaSyAYiBZKx7MnpbEhh9jyipgxe19OcubqV5w
April 1, 2024
47619
Lower middle income
LMC
false
2
1
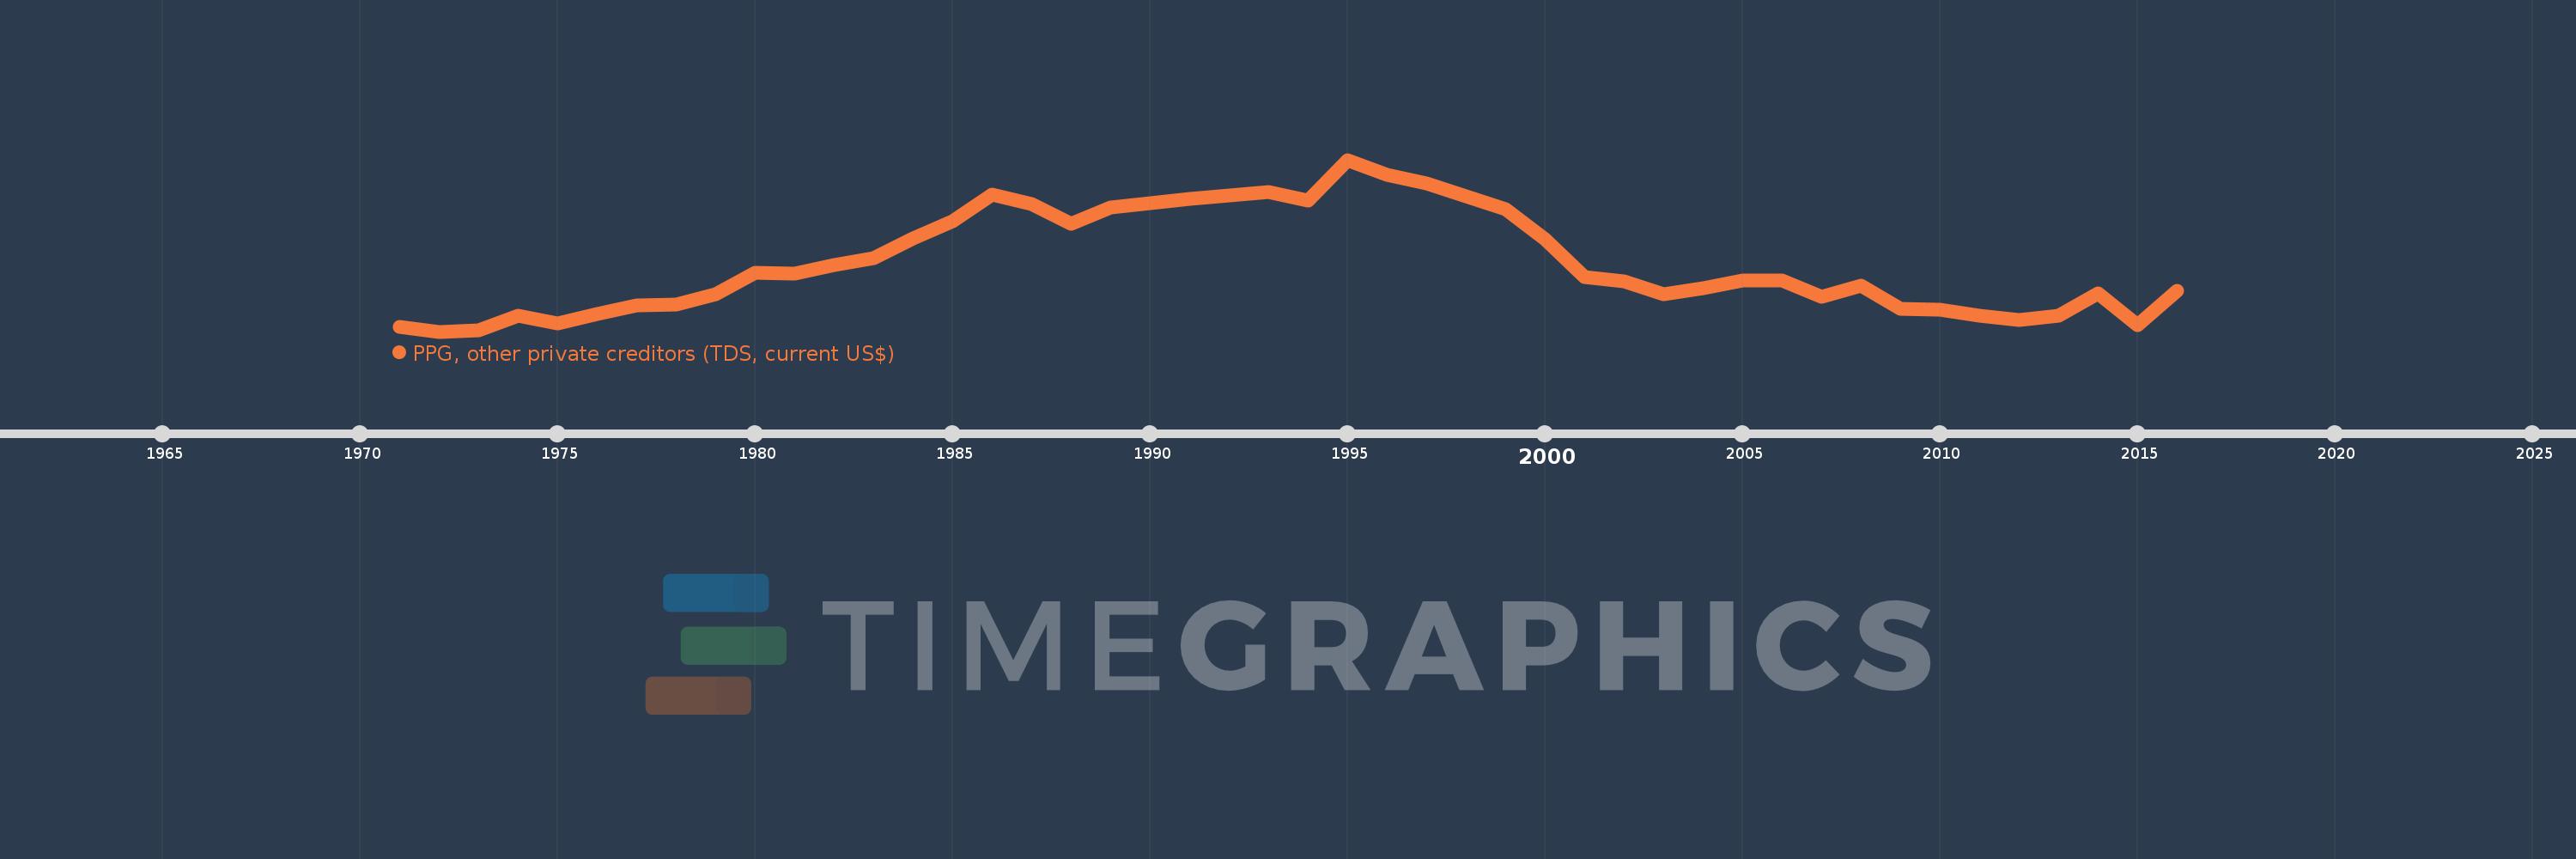
PPG, other private creditors (TDS, current US$)
2016,2015,2014,2013,2012,2011,2010,2009,2008,2007,2006,2005,2004,2003,2002,2001,2000,1999,1998,1997,1996,1995,1994,1993,1992,1991,1990,1989,1988,1987,1986,1985,1984,1983,1982,1981,1980,1979,1978,1977,1976,1975,1974,1973,1972,1971
Cette statistique dans les autres pays:
La ligne de temps
Cette échelle de temps montre un graphique de 1971 année à 2016 année Lower middle income. Les données jusqu'à 1970 année ne sont pas présentés. Quantité d'observations actuelles selon dates: 46.
Source (désignation):
Les indicateurs du développement mondiale
Source (organisation):
World Bank, International Debt Statistics.
Catégories:
External Debt
Dernière mise à jour
23 avr. 2017
Les indicateurs de changement de valeurs selon les années
Minimum:
471.534 mln.
1 janv. 1972
Maximum:
6.598 mds
1 janv. 1995
Pour la date d''observation
Valeur
Changement absolu
Le changement par rapport à la valeur précédente
1 janv. 1971
648.523 mln.
+648.523 mln.
0.0%
1 janv. 1972
471.534 mln.
-176.989 mln.
-27.29%
1 janv. 1973
507.882 mln.
+36.348 mln.
7.71%
1 janv. 1974
1.052 mds
+544.493 mln.
107.21%
1 janv. 1975
767.072 mln.
-285.303 mln.
-27.11%
1 janv. 1976
1.092 mds
+324.49 mln.
42.3%
1 janv. 1977
1.401 mds
+309.87 mln.
28.39%
1 janv. 1978
1.437 mds
+35.495 mln.
2.53%
1 janv. 1979
1.79 mds
+353.543 mln.
24.6%
1 janv. 1980
2.579 mds
+788.188 mln.
44.02%
1 janv. 1981
2.55 mds
-28.526 mln.
-1.11%
1 janv. 1982
2.858 mds
+307.907 mln.
12.07%
1 janv. 1983
3.084 mds
+226.128 mln.
7.91%
1 janv. 1984
3.785 mds
+700.708 mln.
22.72%
1 janv. 1985
4.414 mds
+628.805 mln.
16.61%
1 janv. 1986
5.361 mds
+946.983 mln.
21.46%
1 janv. 1987
5.023 mds
-337.872 mln.
-6.3%
1 janv. 1988
4.323 mds
-700.096 mln.
-13.94%
1 janv. 1989
4.89 mds
+567.155 mln.
13.12%
1 janv. 1990
5.046 mds
+156.201 mln.
3.19%
1 janv. 1991
5.211 mds
+165.139 mln.
3.27%
1 janv. 1992
5.324 mds
+112.434 mln.
2.16%
1 janv. 1993
5.437 mds
+113.153 mln.
2.13%
1 janv. 1994
5.133 mds
-304.219 mln.
-5.6%
1 janv. 1995
6.598 mds
+1.466 mds
28.56%
1 janv. 1996
6.059 mds
-539.259 mln.
-8.17%
1 janv. 1997
5.766 mds
-292.839 mln.
-4.83%
1 janv. 1998
5.299 mds
-467.467 mln.
-8.11%
1 janv. 1999
4.828 mds
-470.406 mln.
-8.88%
1 janv. 2000
3.758 mds
-1.071 mds
-22.18%
1 janv. 2001
2.417 mds
-1.341 mds
-35.68%
1 janv. 2002
2.254 mds
-163.178 mln.
-6.75%
1 janv. 2003
1.794 mds
-460.15 mln.
-20.42%
1 janv. 2004
2.026 mds
+232.152 mln.
12.94%
1 janv. 2005
2.295 mds
+268.82 mln.
13.27%
1 janv. 2006
2.284 mds
-10.47 mln.
-0.46%
1 janv. 2007
1.698 mds
-586.431 mln.
-25.67%
1 janv. 2008
2.114 mds
+416.21 mln.
24.51%
1 janv. 2009
1.279 mds
-834.667 mln.
-39.48%
1 janv. 2010
1.239 mds
-39.923 mln.
-3.12%
1 janv. 2011
1.051 mds
-188.309 mln.
-15.19%
1 janv. 2012
893.311 mln.
-157.815 mln.
-15.01%
1 janv. 2013
1.043 mds
+149.818 mln.
16.77%
1 janv. 2014
1.848 mds
+804.631 mln.
77.14%
1 janv. 2015
691.392 mln.
-1.156 mds
-62.58%
1 janv. 2016
1.939 mds
+1.248 mds
180.48%
Classement des pays selon les statistiques actuelles par années


Commentaires: