29
/fr/
fr
AIzaSyAYiBZKx7MnpbEhh9jyipgxe19OcubqV5w
April 1, 2024
47496
Lower middle income
LMC
false
2
1
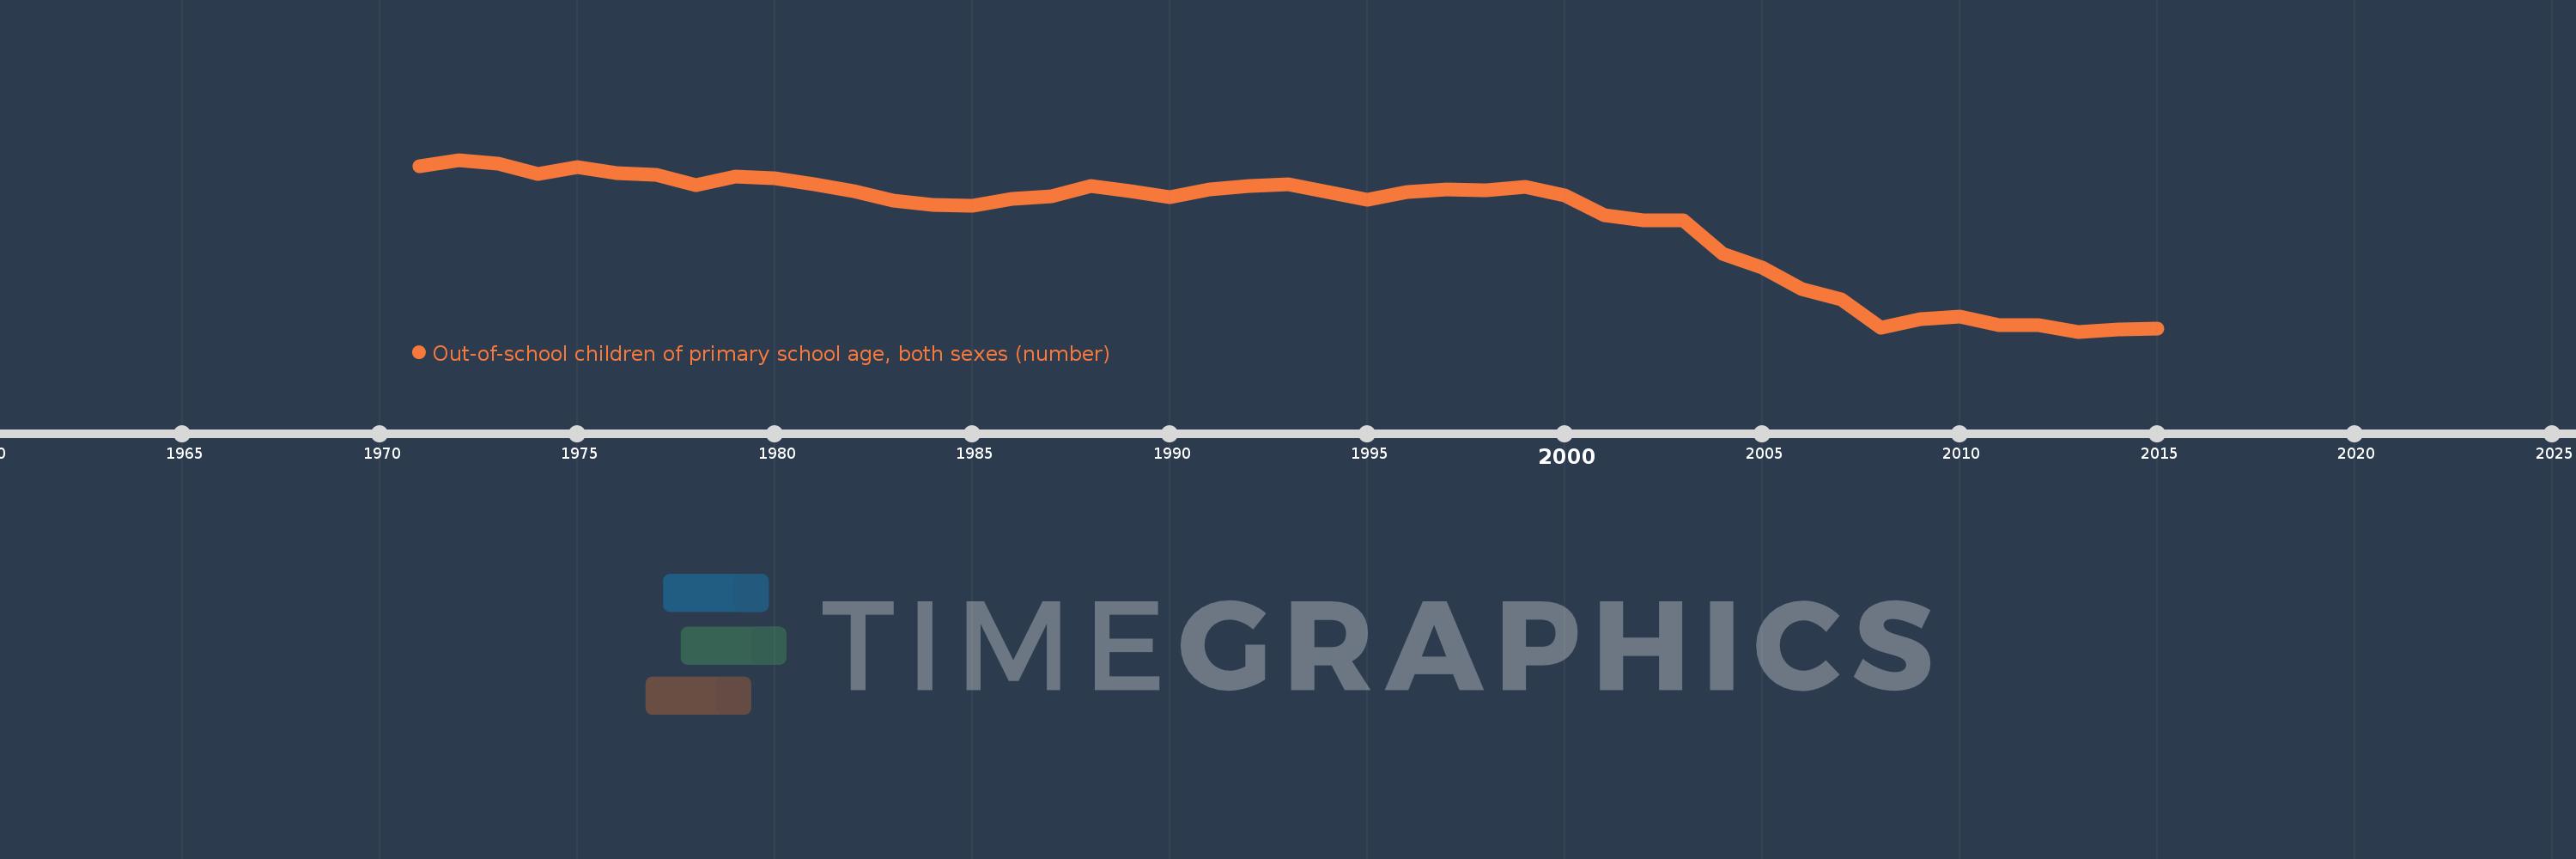
Out-of-school children of primary school age, both sexes (number)
2015,2014,2013,2012,2011,2010,2009,2008,2007,2006,2005,2004,2003,2002,2001,2000,1999,1998,1997,1996,1995,1994,1993,1992,1991,1990,1989,1988,1987,1986,1985,1984,1983,1982,1981,1980,1979,1978,1977,1976,1975,1974,1973,1972,1971
Cette statistique dans les autres pays:
AfghanistanAlbaniaAlgeriaAngolaAntigua and BarbudaArab WorldArgentinaArmeniaArubaAustraliaAustriaAzerbaijanBahamas, TheBahrainBangladeshBarbadosBelarusBelgiumBelizeBeninBermudaBhutanBoliviaBosnia and HerzegovinaBotswanaBrazilBrunei DarussalamBulgariaBurkina FasoBurundiCabo VerdeCambodiaCameroonCanadaCaribbean small statesCentral African RepublicCentral Europe and the BalticsChadChileChinaColombiaComorosCongo, Dem. Rep.Congo, Rep.Costa RicaCote d'IvoireCroatiaCubaCyprusDenmarkDjiboutiDominicaDominican RepublicEarly-demographic dividendEast Asia & PacificEast Asia & Pacific (excluding high income)East Asia & Pacific (IDA & IBRD countries)EcuadorEgypt, Arab Rep.El SalvadorEquatorial GuineaEritreaEstoniaEthiopiaEuro areaEurope & Central AsiaEurope & Central Asia (excluding high income)Europe & Central Asia (IDA & IBRD countries)European UnionFijiFinlandFragile and conflict affected situationsFranceGabonGambia, TheGeorgiaGermanyGhanaGreeceGrenadaGuatemalaGuineaGuinea-BissauGuyanaHaitiHeavily indebted poor countries (HIPC)High incomeHondurasHong Kong SAR, ChinaHungaryIBRD onlyIcelandIDA & IBRD totalIDA blendIDA onlyIDA totalIndiaIndonesiaIran, Islamic Rep.IraqIrelandIsraelItalyJamaicaJapanJordanKazakhstanKenyaKiribatiKorea, Dem. People’s Rep.Korea, Rep.KuwaitKyrgyz RepublicLao PDRLate-demographic dividendLatin America & Caribbean Latin America & Caribbean (excluding high income)Latin America & the Caribbean (IDA & IBRD countries)LatviaLeast developed countries: UN classificationLebanonLesothoLiberiaLibyaLiechtensteinLithuaniaLow & middle incomeLow incomeLower middle incomeLuxembourgMacao SAR, ChinaMacedonia, FYRMadagascarMalawiMalaysiaMaldivesMaliMaltaMarshall IslandsMauritaniaMauritiusMexicoMicronesia, Fed. Sts.Middle East & North AfricaMiddle East & North Africa (excluding high income)Middle East & North Africa (IDA & IBRD countries)Middle incomeMoldovaMongoliaMontenegroMoroccoMozambiqueMyanmarNamibiaNauruNepalNetherlandsNew ZealandNicaraguaNigerNigeriaNorth AmericaNorwayOECD membersOmanOther small statesPacific island small statesPakistanPalauPanamaPapua New GuineaParaguayPeruPhilippinesPolandPortugalPost-demographic dividendPre-demographic dividendPuerto RicoQatarRomaniaRussian FederationRwandaSamoaSan MarinoSao Tome and PrincipeSaudi ArabiaSenegalSerbiaSeychellesSierra LeoneSloveniaSmall statesSolomon IslandsSomaliaSouth AfricaSouth AsiaSouth Asia (IDA & IBRD)South SudanSpainSri LankaSt. Kitts and NevisSt. LuciaSt. Vincent and the GrenadinesSub-Saharan Africa Sub-Saharan Africa (excluding high income)Sub-Saharan Africa (IDA & IBRD countries)SudanSurinameSwazilandSwedenSwitzerlandSyrian Arab RepublicTajikistanTanzaniaThailandTimor-LesteTogoTongaTrinidad and TobagoTunisiaTurkeyTuvaluUgandaUkraineUnited Arab EmiratesUnited KingdomUnited StatesUpper middle incomeUruguayUzbekistanVanuatuVenezuela, RBVietnamWest Bank and GazaWorldYemen, Rep.ZambiaZimbabwe La ligne de temps
Cette échelle de temps montre un graphique de 1971 année à 2015 année Lower middle income. Les données jusqu'à 1970 année ne sont pas présentés. Quantité d'observations actuelles selon dates: 45.
Source (désignation):
Les indicateurs du développement mondiale
Source (organisation):
UNESCO Institute for Statistics
Catégories:
Education
Dernière mise à jour
23 avr. 2017
Les indicateurs de changement de valeurs selon les années
Minimum:
29.678 mln.
1 janv. 2013
Maximum:
65.292 mln.
1 janv. 1972
Pour la date d''observation
Valeur
Changement absolu
Le changement par rapport à la valeur précédente
1 janv. 1971
64.002 mln.
+64.002 mln.
0.0%
1 janv. 1972
65.292 mln.
+1.29 mln.
2.02%
1 janv. 1973
64.54 mln.
-752.304 milles
-1.15%
1 janv. 1974
62.419 mln.
-2.121 mln.
-3.29%
1 janv. 1975
63.767 mln.
+1.348 mln.
2.16%
1 janv. 1976
62.569 mln.
-1.198 mln.
-1.88%
1 janv. 1977
62.25 mln.
-319.024 milles
-0.51%
1 janv. 1978
60.058 mln.
-2.192 mln.
-3.52%
1 janv. 1979
61.873 mln.
+1.815 mln.
3.02%
1 janv. 1980
61.38 mln.
-493.228 milles
-0.8%
1 janv. 1981
60.212 mln.
-1.168 mln.
-1.9%
1 janv. 1982
58.735 mln.
-1.477 mln.
-2.45%
1 janv. 1983
56.84 mln.
-1.896 mln.
-3.23%
1 janv. 1984
55.993 mln.
-847.06 milles
-1.49%
1 janv. 1985
55.823 mln.
-169.328 milles
-0.3%
1 janv. 1986
57.202 mln.
+1.379 mln.
2.47%
1 janv. 1987
57.742 mln.
+539.772 milles
0.94%
1 janv. 1988
59.887 mln.
+2.146 mln.
3.72%
1 janv. 1989
58.728 mln.
-1.159 mln.
-1.94%
1 janv. 1990
57.508 mln.
-1.22 mln.
-2.08%
1 janv. 1991
59.085 mln.
+1.578 mln.
2.74%
1 janv. 1992
59.795 mln.
+709.876 milles
1.2%
1 janv. 1993
60.27 mln.
+474.304 milles
0.79%
1 janv. 1994
58.676 mln.
-1.594 mln.
-2.64%
1 janv. 1995
57.01 mln.
-1.666 mln.
-2.84%
1 janv. 1996
58.529 mln.
+1.519 mln.
2.66%
1 janv. 1997
59.182 mln.
+653.308 milles
1.12%
1 janv. 1998
59.025 mln.
-157.284 milles
-0.27%
1 janv. 1999
59.688 mln.
+662.844 milles
1.12%
1 janv. 2000
57.873 mln.
-1.815 mln.
-3.04%
1 janv. 2001
53.884 mln.
-3.988 mln.
-6.89%
1 janv. 2002
52.752 mln.
-1.133 mln.
-2.1%
1 janv. 2003
52.703 mln.
-48.82 milles
-0.09%
1 janv. 2004
45.715 mln.
-6.988 mln.
-13.26%
1 janv. 2005
42.962 mln.
-2.752 mln.
-6.02%
1 janv. 2006
38.55 mln.
-4.412 mln.
-10.27%
1 janv. 2007
36.341 mln.
-2.209 mln.
-5.73%
1 janv. 2008
30.55 mln.
-5.791 mln.
-15.93%
1 janv. 2009
32.18 mln.
+1.63 mln.
5.34%
1 janv. 2010
32.797 mln.
+617.154 milles
1.92%
1 janv. 2011
30.978 mln.
-1.819 mln.
-5.54%
1 janv. 2012
31.086 mln.
+107.508 milles
0.35%
1 janv. 2013
29.678 mln.
-1.408 mln.
-4.53%
1 janv. 2014
30.21 mln.
+532.54 milles
1.79%
1 janv. 2015
30.377 mln.
+166.138 milles
0.55%
Classement des pays selon les statistiques actuelles par années


Commentaires: