29
/fr/
fr
AIzaSyAYiBZKx7MnpbEhh9jyipgxe19OcubqV5w
April 1, 2024
46314
Low income
LIC
false
2
1
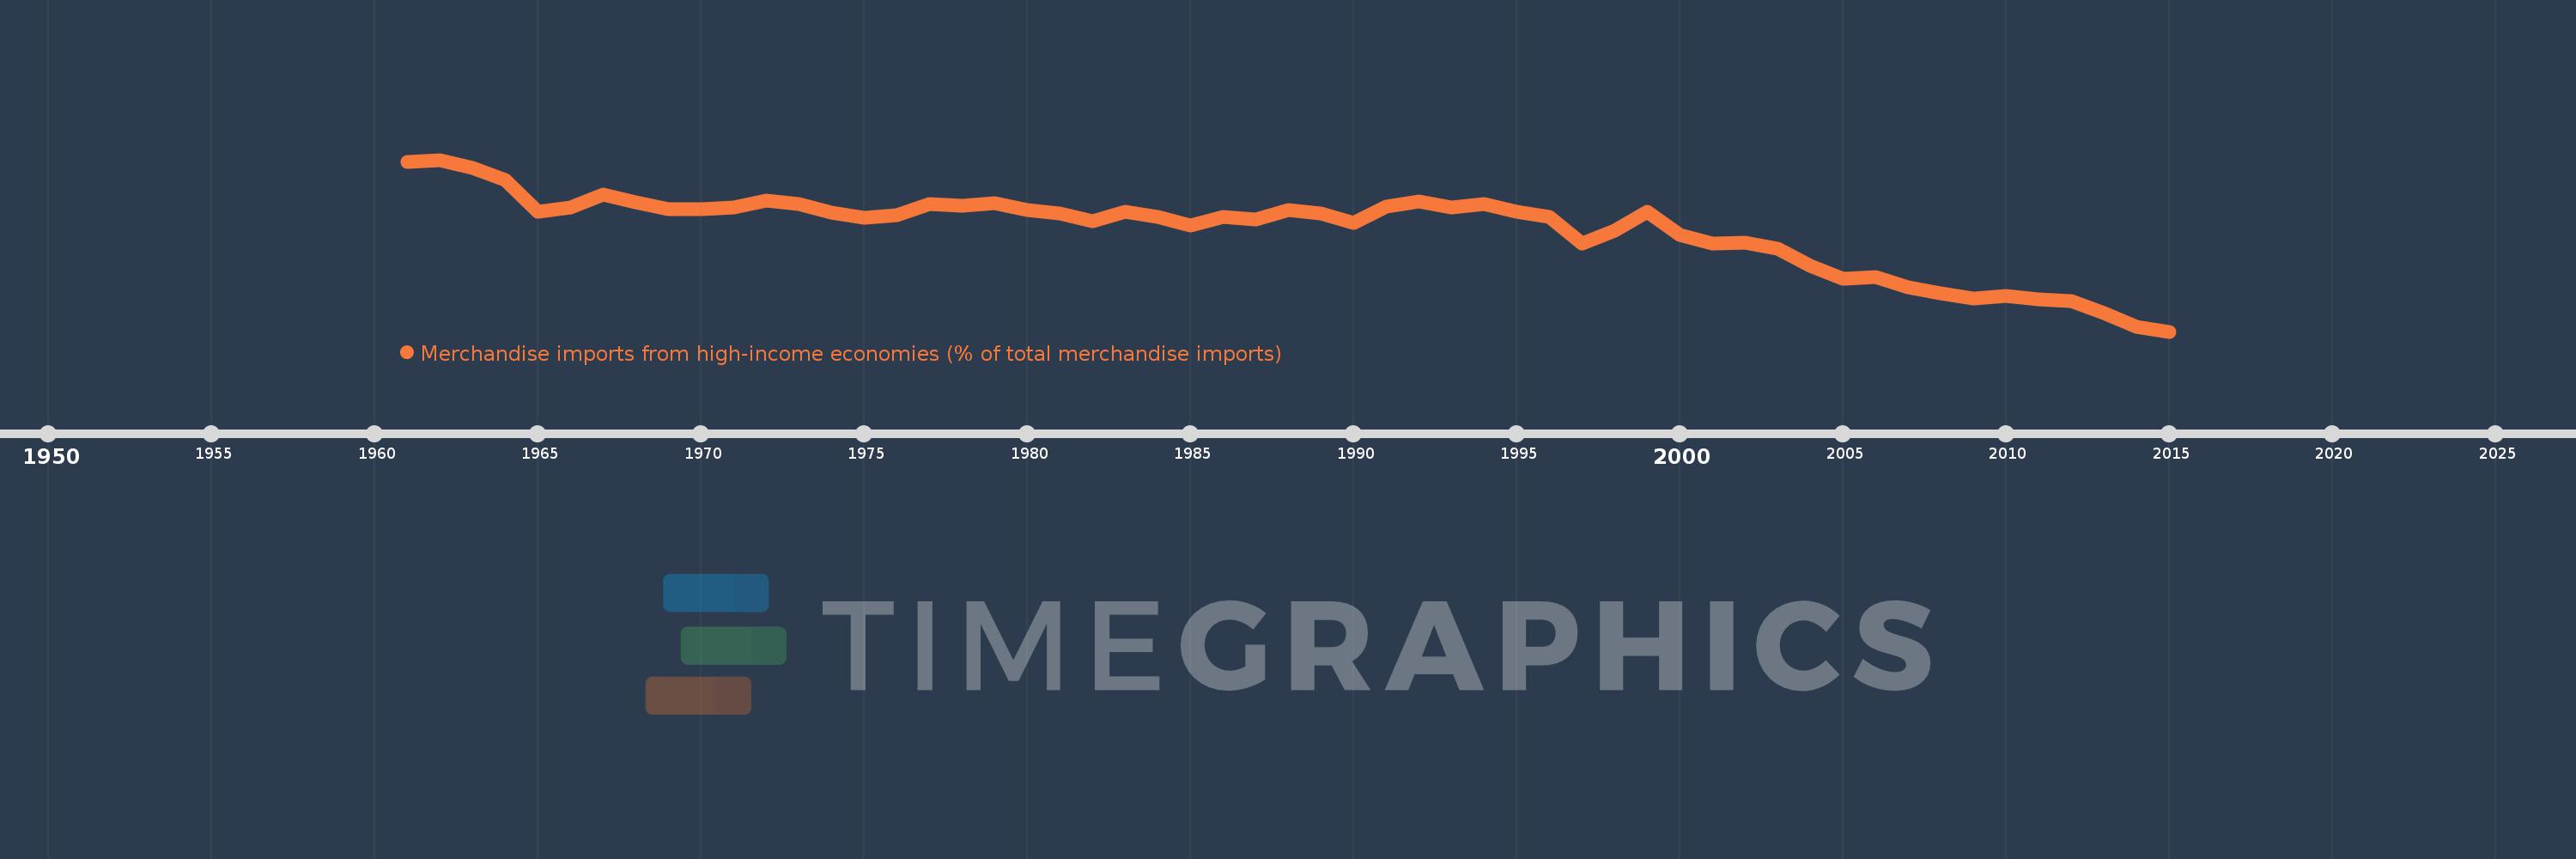
Merchandise imports from high-income economies (% of total merchandise imports)
2015,2014,2013,2012,2011,2010,2009,2008,2007,2006,2005,2004,2003,2002,2001,2000,1999,1998,1997,1996,1995,1994,1993,1992,1991,1990,1989,1988,1987,1986,1985,1984,1983,1982,1981,1980,1979,1978,1977,1976,1975,1974,1973,1972,1971,1970,1969,1968,1967,1966,1965,1964,1963,1962,1961
Cette statistique dans les autres pays:
AfghanistanAlbaniaAlgeriaAngolaAntigua and BarbudaArab WorldArgentinaArmeniaArubaAustraliaAustriaAzerbaijanBahamas, TheBahrainBangladeshBarbadosBelarusBelgiumBelizeBeninBermudaBoliviaBosnia and HerzegovinaBrazilBrunei DarussalamBulgariaBurkina FasoBurundiCabo VerdeCambodiaCameroonCanadaCaribbean small statesCentral African RepublicCentral Europe and the BalticsChadChileChinaColombiaComorosCongo, Dem. Rep.Congo, Rep.Costa RicaCote d'IvoireCroatiaCubaCyprusCzech RepublicDenmarkDjiboutiDominicaDominican RepublicEarly-demographic dividendEast Asia & PacificEast Asia & Pacific (excluding high income)East Asia & Pacific (IDA & IBRD countries)EcuadorEgypt, Arab Rep.El SalvadorEquatorial GuineaEstoniaEthiopiaEuro areaEurope & Central AsiaEurope & Central Asia (excluding high income)Europe & Central Asia (IDA & IBRD countries)European UnionFaroe IslandsFijiFinlandFragile and conflict affected situationsFranceFrench PolynesiaGabonGambia, TheGeorgiaGermanyGhanaGibraltarGreeceGreenlandGrenadaGuamGuatemalaGuineaGuinea-BissauGuyanaHaitiHeavily indebted poor countries (HIPC)High incomeHondurasHong Kong SAR, ChinaHungaryIBRD onlyIcelandIDA & IBRD totalIDA blendIDA onlyIDA totalIndiaIndonesiaIran, Islamic Rep.IraqIrelandIsraelItalyJamaicaJapanJordanKazakhstanKenyaKiribatiKorea, Dem. People’s Rep.Korea, Rep.KosovoKuwaitKyrgyz RepublicLao PDRLate-demographic dividendLatin America & Caribbean Latin America & Caribbean (excluding high income)Latin America & the Caribbean (IDA & IBRD countries)LatviaLeast developed countries: UN classificationLebanonLiberiaLibyaLithuaniaLow & middle incomeLow incomeLower middle incomeLuxembourgMacao SAR, ChinaMacedonia, FYRMadagascarMalawiMalaysiaMaldivesMaliMaltaMauritaniaMauritiusMexicoMiddle East & North AfricaMiddle East & North Africa (excluding high income)Middle East & North Africa (IDA & IBRD countries)Middle incomeMoldovaMongoliaMontenegroMoroccoMozambiqueMyanmarNauruNepalNetherlandsNew CaledoniaNew ZealandNicaraguaNigerNigeriaNorth AmericaNorwayOECD membersOmanOther small statesPacific island small statesPakistanPanamaPapua New GuineaParaguayPeruPhilippinesPolandPortugalPost-demographic dividendPre-demographic dividendQatarRomaniaRussian FederationRwandaSamoaSao Tome and PrincipeSaudi ArabiaSenegalSerbiaSeychellesSierra LeoneSingaporeSlovak RepublicSloveniaSmall statesSolomon IslandsSomaliaSouth AfricaSouth AsiaSouth Asia (IDA & IBRD)SpainSri LankaSt. Kitts and NevisSt. LuciaSt. Vincent and the GrenadinesSub-Saharan Africa Sub-Saharan Africa (excluding high income)Sub-Saharan Africa (IDA & IBRD countries)SudanSurinameSwedenSwitzerlandSyrian Arab RepublicTajikistanTanzaniaThailandTogoTongaTrinidad and TobagoTunisiaTurkeyTurkmenistanTuvaluUgandaUkraineUnited Arab EmiratesUnited KingdomUnited StatesUpper middle incomeUruguayUzbekistanVanuatuVenezuela, RBVietnamWorldYemen, Rep.ZambiaZimbabwe La ligne de temps
Cette échelle de temps montre un graphique de 1961 année à 2015 année Low income. Les données jusqu'à 1960 année ne sont pas présentés. Quantité d'observations actuelles selon dates: 55.
Source (désignation):
Les indicateurs du développement mondiale
Source (organisation):
World Bank staff estimates based data from International Monetary Fund's Direction of Trade database.
Catégories:
Private Sector, Trade
Dernière mise à jour
23 avr. 2017
Les indicateurs de changement de valeurs selon les années
Minimum:
33.331
1 janv. 2015
Maximum:
79.23
1 janv. 1962
Pour la date d''observation
Valeur
Changement absolu
Le changement par rapport à la valeur précédente
1 janv. 1961
78.648
+78.648
0.0%
1 janv. 1962
79.23
+0.581
0.74%
1 janv. 1963
77.009
-2.221
-2.8%
1 janv. 1964
73.728
-3.281
-4.26%
1 janv. 1965
65.354
-8.374
-11.36%
1 janv. 1966
66.487
+1.133
1.73%
1 janv. 1967
69.98
+3.492
5.25%
1 janv. 1968
67.969
-2.01
-2.87%
1 janv. 1969
66.03
-1.94
-2.85%
1 janv. 1970
66.031
+0.002
0.0%
1 janv. 1971
66.455
+0.423
0.64%
1 janv. 1972
68.239
+1.785
2.69%
1 janv. 1973
67.348
-0.891
-1.31%
1 janv. 1974
65.114
-2.234
-3.32%
1 janv. 1975
63.719
-1.395
-2.14%
1 janv. 1976
64.48
+0.76
1.19%
1 janv. 1977
67.51
+3.03
4.7%
1 janv. 1978
66.99
-0.519
-0.77%
1 janv. 1979
67.584
+0.594
0.89%
1 janv. 1980
65.819
-1.765
-2.61%
1 janv. 1981
64.831
-0.988
-1.5%
1 janv. 1982
62.744
-2.088
-3.22%
1 janv. 1983
65.399
+2.655
4.23%
1 janv. 1984
63.882
-1.517
-2.32%
1 janv. 1985
61.672
-2.21
-3.46%
1 janv. 1986
63.919
+2.246
3.64%
1 janv. 1987
63.28
-0.639
-1.0%
1 janv. 1988
65.792
+2.512
3.97%
1 janv. 1989
64.97
-0.822
-1.25%
1 janv. 1990
62.34
-2.631
-4.05%
1 janv. 1991
66.691
+4.351
6.98%
1 janv. 1992
68.125
+1.435
2.15%
1 janv. 1993
66.572
-1.553
-2.28%
1 janv. 1994
67.297
+0.724
1.09%
1 janv. 1995
65.287
-2.01
-2.99%
1 janv. 1996
63.878
-1.41
-2.16%
1 janv. 1997
56.825
-7.053
-11.04%
1 janv. 1998
60.3
+3.475
6.11%
1 janv. 1999
65.343
+5.044
8.36%
1 janv. 2000
59.042
-6.301
-9.64%
1 janv. 2001
56.849
-2.192
-3.71%
1 janv. 2002
57.062
+0.213
0.37%
1 janv. 2003
55.499
-1.563
-2.74%
1 janv. 2004
50.964
-4.535
-8.17%
1 janv. 2005
47.372
-3.592
-7.05%
1 janv. 2006
47.948
+0.576
1.22%
1 janv. 2007
45.062
-2.886
-6.02%
1 janv. 2008
43.58
-1.483
-3.29%
1 janv. 2009
42.102
-1.477
-3.39%
1 janv. 2010
42.825
+0.722
1.72%
1 janv. 2011
42.001
-0.824
-1.92%
1 janv. 2012
41.517
-0.483
-1.15%
1 janv. 2013
38.176
-3.341
-8.05%
1 janv. 2014
34.498
-3.678
-9.63%
1 janv. 2015
33.331
-1.167
-3.38%
Classement des pays selon les statistiques actuelles par années


Commentaires: