29
/fr/
fr
AIzaSyAYiBZKx7MnpbEhh9jyipgxe19OcubqV5w
April 1, 2024
44653
Least developed countries: UN classification
LDC
false
2
1
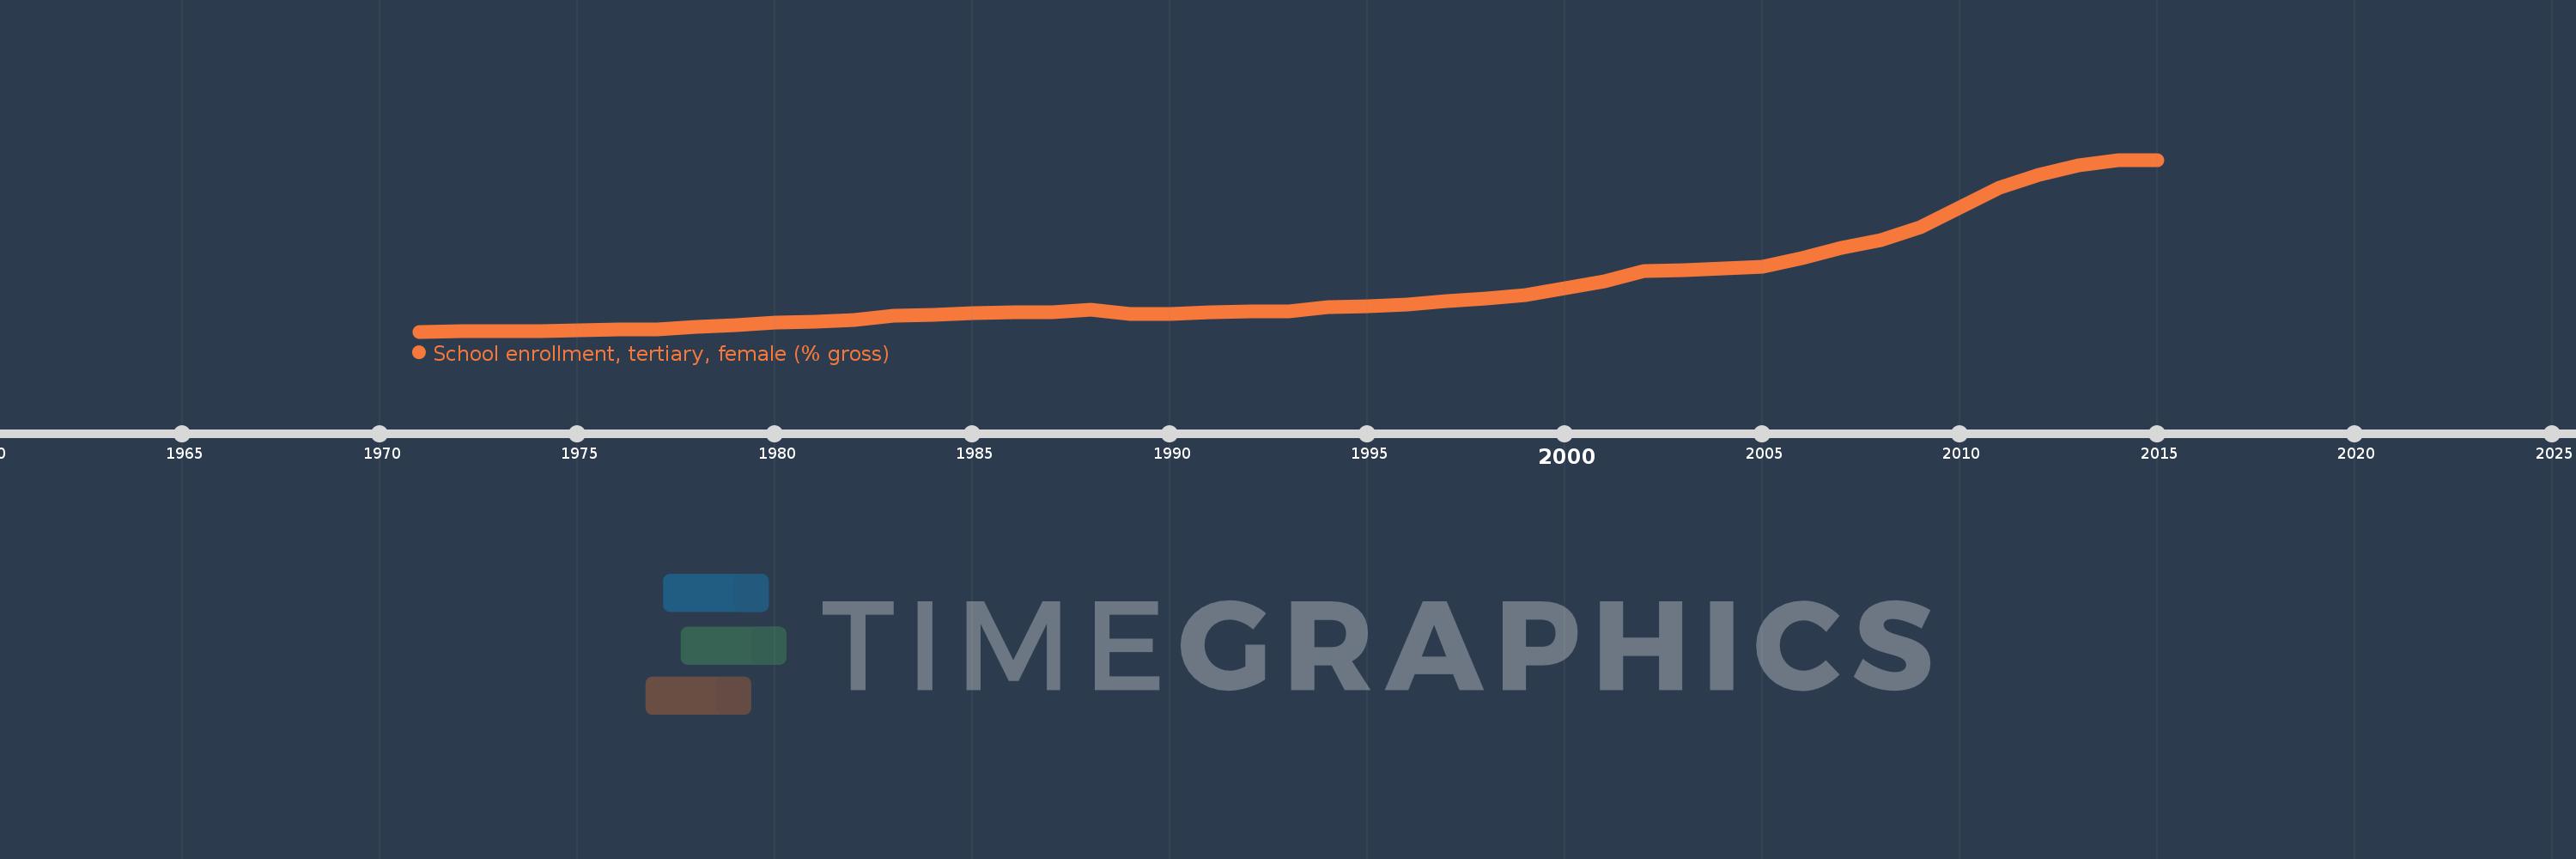
School enrollment, tertiary, female (% gross)
2015,2014,2013,2012,2011,2010,2009,2008,2007,2006,2005,2004,2003,2002,2001,2000,1999,1998,1997,1996,1995,1994,1993,1992,1991,1990,1989,1988,1987,1986,1985,1984,1983,1982,1981,1980,1979,1978,1977,1976,1975,1974,1973,1972,1971
Cette statistique dans les autres pays:
AfghanistanAlbaniaAlgeriaAngolaAntigua and BarbudaArab WorldArgentinaArmeniaArubaAustraliaAustriaAzerbaijanBahamas, TheBahrainBangladeshBarbadosBelarusBelgiumBelizeBeninBermudaBhutanBoliviaBosnia and HerzegovinaBotswanaBrazilBrunei DarussalamBulgariaBurkina FasoBurundiCabo VerdeCambodiaCameroonCanadaCaribbean small statesCentral African RepublicCentral Europe and the BalticsChadChileChinaColombiaComorosCongo, Dem. Rep.Congo, Rep.Costa RicaCote d'IvoireCroatiaCubaCuracaoCyprusCzech RepublicDenmarkDjiboutiDominicaDominican RepublicEarly-demographic dividendEast Asia & PacificEast Asia & Pacific (excluding high income)East Asia & Pacific (IDA & IBRD countries)EcuadorEgypt, Arab Rep.El SalvadorEquatorial GuineaEritreaEstoniaEthiopiaEuro areaEurope & Central AsiaEurope & Central Asia (excluding high income)Europe & Central Asia (IDA & IBRD countries)European UnionFijiFinlandFragile and conflict affected situationsFranceGabonGambia, TheGeorgiaGermanyGhanaGreeceGrenadaGuatemalaGuineaGuinea-BissauGuyanaHaitiHeavily indebted poor countries (HIPC)High incomeHondurasHong Kong SAR, ChinaHungaryIBRD onlyIcelandIDA & IBRD totalIDA blendIDA onlyIDA totalIndiaIndonesiaIran, Islamic Rep.IraqIrelandIsraelItalyJamaicaJapanJordanKazakhstanKenyaKorea, Dem. People’s Rep.Korea, Rep.KuwaitKyrgyz RepublicLao PDRLate-demographic dividendLatin America & Caribbean Latin America & Caribbean (excluding high income)Latin America & the Caribbean (IDA & IBRD countries)LatviaLeast developed countries: UN classificationLebanonLesothoLiberiaLibyaLiechtensteinLithuaniaLow & middle incomeLow incomeLower middle incomeLuxembourgMacao SAR, ChinaMacedonia, FYRMadagascarMalawiMaldivesMaliMaltaMarshall IslandsMauritaniaMauritiusMexicoMicronesia, Fed. Sts.Middle East & North AfricaMiddle East & North Africa (excluding high income)Middle East & North Africa (IDA & IBRD countries)Middle incomeMoldovaMongoliaMontenegroMoroccoMozambiqueMyanmarNamibiaNepalNetherlandsNew ZealandNicaraguaNigerNigeriaNorth AmericaNorwayOECD membersOmanOther small statesPacific island small statesPakistanPalauPanamaPapua New GuineaParaguayPeruPhilippinesPolandPortugalPost-demographic dividendPre-demographic dividendPuerto RicoQatarRomaniaRussian FederationRwandaSamoaSan MarinoSao Tome and PrincipeSaudi ArabiaSenegalSerbiaSeychellesSierra LeoneSingaporeSlovak RepublicSloveniaSmall statesSomaliaSouth AfricaSouth AsiaSouth Asia (IDA & IBRD)SpainSri LankaSt. Kitts and NevisSt. LuciaSt. Vincent and the GrenadinesSub-Saharan Africa Sub-Saharan Africa (excluding high income)Sub-Saharan Africa (IDA & IBRD countries)SudanSurinameSwazilandSwedenSwitzerlandSyrian Arab RepublicTajikistanTanzaniaThailandTimor-LesteTogoTongaTrinidad and TobagoTunisiaTurkeyTurkmenistanUgandaUkraineUnited Arab EmiratesUnited KingdomUnited StatesUpper middle incomeUruguayUzbekistanVanuatuVenezuela, RBVietnamWest Bank and GazaWorldYemen, Rep.ZambiaZimbabwe La ligne de temps
Cette échelle de temps montre un graphique de 1971 année à 2015 année Least developed countries: UN classification. Les données jusqu'à 1970 année ne sont pas présentés. Quantité d'observations actuelles selon dates: 45.
Source (désignation):
Les indicateurs du développement mondiale
Source (organisation):
United Nations Educational, Scientific, and Cultural Organization (UNESCO) Institute for Statistics.
Catégories:
Education, Gender
Dernière mise à jour
23 avr. 2017
Les indicateurs de changement de valeurs selon les années
Minimum:
0.974
1 janv. 1971
Maximum:
7.278
1 janv. 2015
Pour la date d''observation
Valeur
Changement absolu
Le changement par rapport à la valeur précédente
1 janv. 1971
0.974
+0.974
0.0%
1 janv. 1972
0.976
+0.002
0.2%
1 janv. 1973
0.991
+0.015
1.5%
1 janv. 1974
1.0
+0.009
0.94%
1 janv. 1975
1.032
+0.032
3.2%
1 janv. 1976
1.04
+0.008
0.77%
1 janv. 1977
1.046
+0.005
0.52%
1 janv. 1978
1.159
+0.113
10.84%
1 janv. 1979
1.195
+0.036
3.07%
1 janv. 1980
1.299
+0.104
8.72%
1 janv. 1981
1.352
+0.053
4.08%
1 janv. 1982
1.394
+0.042
3.1%
1 janv. 1983
1.561
+0.167
12.0%
1 janv. 1984
1.593
+0.032
2.02%
1 janv. 1985
1.639
+0.046
2.9%
1 janv. 1986
1.692
+0.054
3.27%
1 janv. 1987
1.682
-0.01
-0.61%
1 janv. 1988
1.792
+0.11
6.52%
1 janv. 1989
1.632
-0.159
-8.89%
1 janv. 1990
1.635
+0.003
0.17%
1 janv. 1991
1.67
+0.035
2.11%
1 janv. 1992
1.703
+0.033
1.98%
1 janv. 1993
1.716
+0.014
0.8%
1 janv. 1994
1.883
+0.167
9.73%
1 janv. 1995
1.903
+0.02
1.06%
1 janv. 1996
1.968
+0.064
3.38%
1 janv. 1997
2.078
+0.11
5.61%
1 janv. 1998
2.175
+0.097
4.68%
1 janv. 1999
2.311
+0.136
6.25%
1 janv. 2000
2.554
+0.243
10.49%
1 janv. 2001
2.811
+0.258
10.09%
1 janv. 2002
3.206
+0.395
14.05%
1 janv. 2003
3.229
+0.023
0.72%
1 janv. 2004
3.302
+0.073
2.26%
1 janv. 2005
3.36
+0.057
1.73%
1 janv. 2006
3.682
+0.322
9.59%
1 janv. 2007
4.04
+0.358
9.73%
1 janv. 2008
4.336
+0.296
7.34%
1 janv. 2009
4.799
+0.463
10.68%
1 janv. 2010
5.54
+0.74
15.43%
1 janv. 2011
6.246
+0.707
12.75%
1 janv. 2012
6.742
+0.495
7.93%
1 janv. 2013
7.073
+0.331
4.91%
1 janv. 2014
7.274
+0.201
2.84%
1 janv. 2015
7.278
+0.004
0.05%
Classement des pays selon les statistiques actuelles par années


Commentaires: