29
/fr/
fr
AIzaSyAYiBZKx7MnpbEhh9jyipgxe19OcubqV5w
April 1, 2024
44512
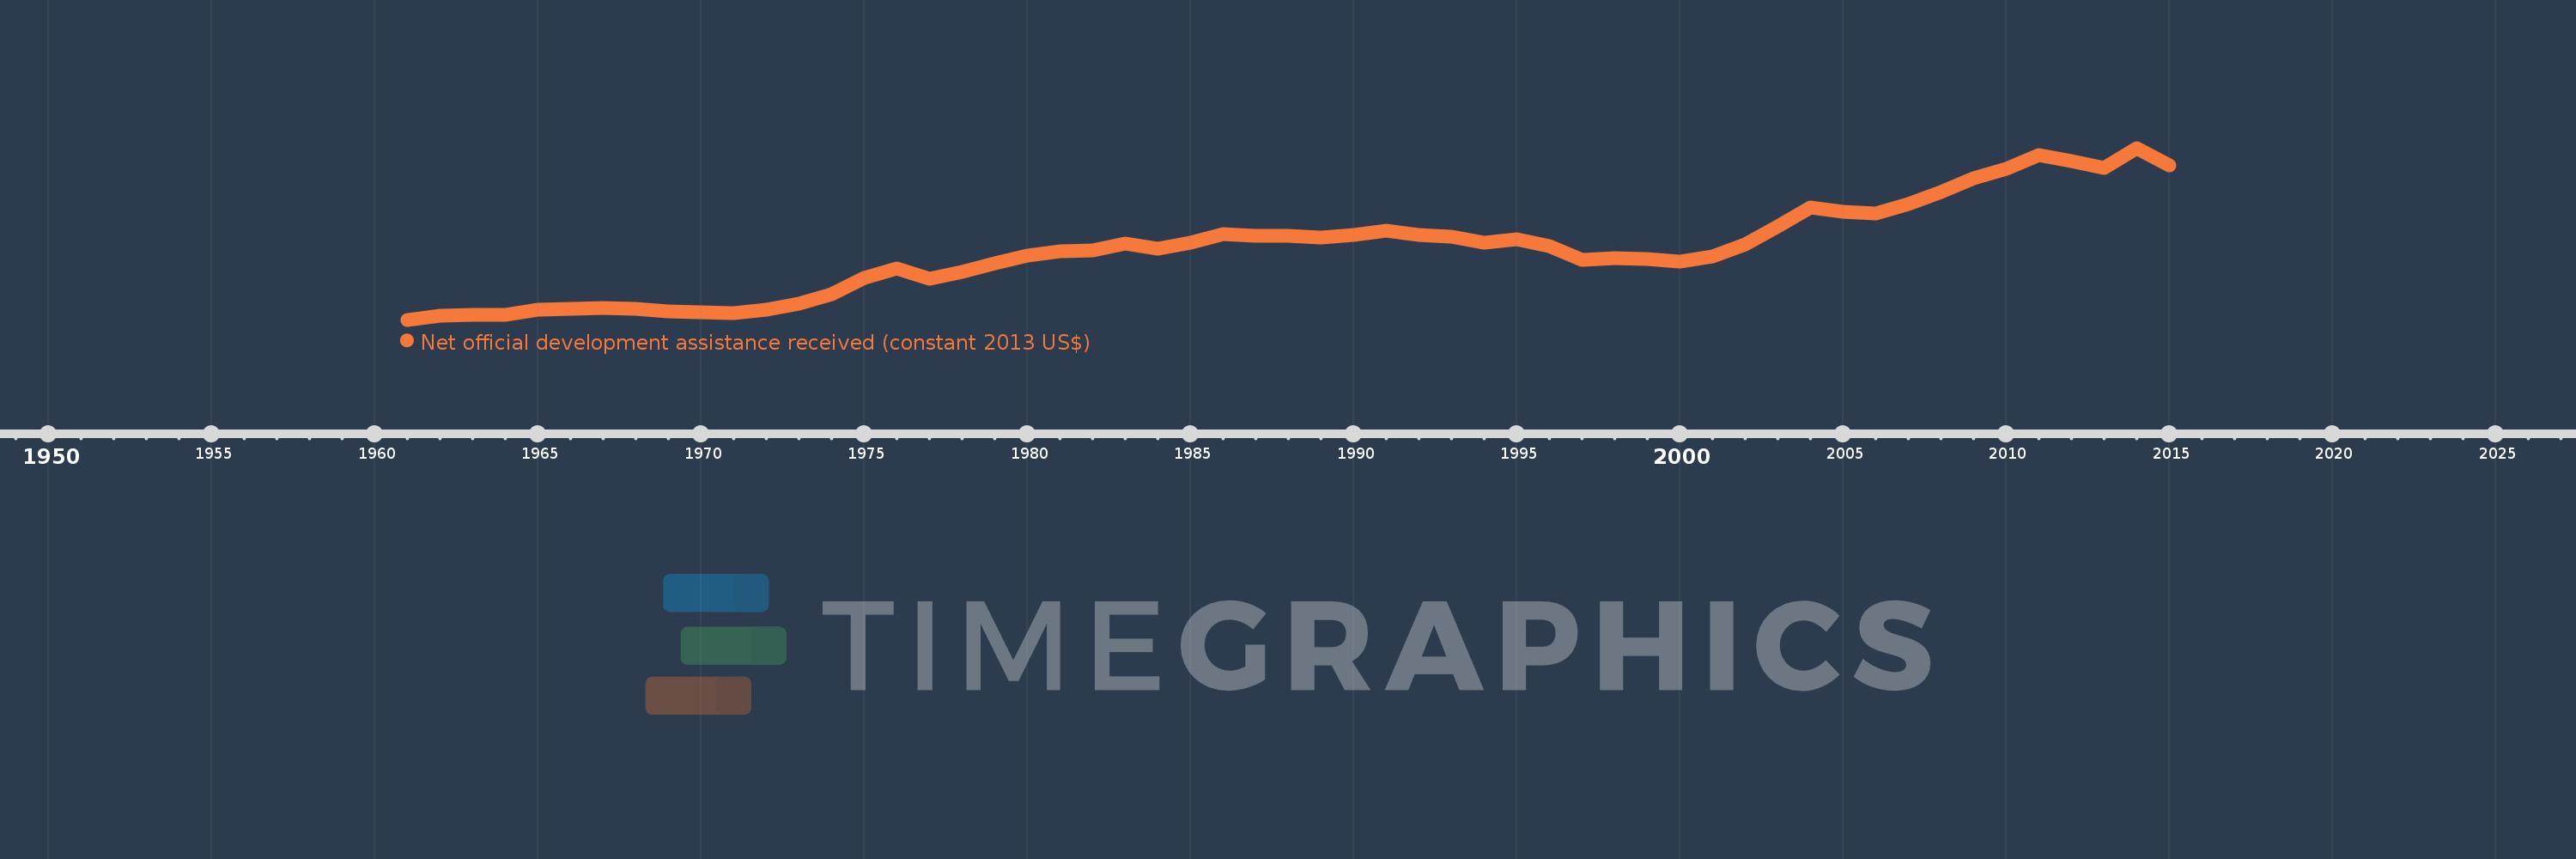
Least developed countries: UN classification
LDC
false
2
1
Net official development assistance received (constant 2013 US$)
2015,2014,2013,2012,2011,2010,2009,2008,2007,2006,2005,2004,2003,2002,2001,2000,1999,1998,1997,1996,1995,1994,1993,1992,1991,1990,1989,1988,1987,1986,1985,1984,1983,1982,1981,1980,1979,1978,1977,1976,1975,1974,1973,1972,1971,1970,1969,1968,1967,1966,1965,1964,1963,1962,1961
Cette statistique dans les autres pays:
AfghanistanAlbaniaAlgeriaAngolaAntigua and BarbudaArab WorldArgentinaArmeniaArubaAzerbaijanBahamas, TheBahrainBangladeshBarbadosBelarusBelizeBeninBermudaBhutanBoliviaBosnia and HerzegovinaBotswanaBrazilBritish Virgin IslandsBrunei DarussalamBurkina FasoBurundiCabo VerdeCambodiaCameroonCaribbean small statesCayman IslandsCentral African RepublicCentral Europe and the BalticsChadChileChinaColombiaComorosCongo, Dem. Rep.Congo, Rep.Costa RicaCote d'IvoireCroatiaCubaCyprusDjiboutiDominicaDominican RepublicEast Asia & PacificEast Asia & Pacific (excluding high income)East Asia & Pacific (IDA & IBRD countries)EcuadorEgypt, Arab Rep.El SalvadorEquatorial GuineaEritreaEthiopiaEuro areaEurope & Central AsiaEurope & Central Asia (excluding high income)Europe & Central Asia (IDA & IBRD countries)European UnionFijiFragile and conflict affected situationsFrench PolynesiaGabonGambia, TheGeorgiaGhanaGibraltarGrenadaGuatemalaGuineaGuinea-BissauGuyanaHaitiHeavily indebted poor countries (HIPC)High incomeHondurasHong Kong SAR, ChinaIBRD onlyIDA & IBRD totalIDA blendIDA onlyIDA totalIndiaIndonesiaIran, Islamic Rep.IraqIsraelJamaicaJordanKazakhstanKenyaKiribatiKorea, Dem. People’s Rep.Korea, Rep.KosovoKuwaitKyrgyz RepublicLao PDRLatin America & Caribbean Latin America & Caribbean (excluding high income)Latin America & the Caribbean (IDA & IBRD countries)Least developed countries: UN classificationLebanonLesothoLiberiaLibyaLow & middle incomeLow incomeLower middle incomeMacao SAR, ChinaMacedonia, FYRMadagascarMalawiMalaysiaMaldivesMaliMaltaMarshall IslandsMauritaniaMauritiusMexicoMicronesia, Fed. Sts.Middle East & North AfricaMiddle East & North Africa (excluding high income)Middle East & North Africa (IDA & IBRD countries)Middle incomeMoldovaMongoliaMontenegroMoroccoMozambiqueMyanmarNamibiaNauruNepalNew CaledoniaNicaraguaNigerNigeriaNorth AmericaNorthern Mariana IslandsOECD membersOmanOther small statesPacific island small statesPakistanPalauPanamaPapua New GuineaParaguayPeruPhilippinesQatarRwandaSamoaSao Tome and PrincipeSaudi ArabiaSenegalSerbiaSeychellesSierra LeoneSingaporeSloveniaSmall statesSolomon IslandsSomaliaSouth AfricaSouth AsiaSouth Asia (IDA & IBRD)South SudanSri LankaSt. Kitts and NevisSt. LuciaSt. Vincent and the GrenadinesSub-Saharan Africa Sub-Saharan Africa (excluding high income)Sub-Saharan Africa (IDA & IBRD countries)SudanSurinameSwazilandSyrian Arab RepublicTajikistanTanzaniaThailandTimor-LesteTogoTongaTrinidad and TobagoTunisiaTurkeyTurkmenistanTurks and Caicos IslandsTuvaluUgandaUkraineUnited Arab EmiratesUpper middle incomeUruguayUzbekistanVanuatuVenezuela, RBVietnamWest Bank and GazaWorldYemen, Rep.ZambiaZimbabwe La ligne de temps
Cette échelle de temps montre un graphique de 1961 année à 2015 année Least developed countries: UN classification. Les données jusqu'à 1960 année ne sont pas présentés. Quantité d'observations actuelles selon dates: 55.
Source (désignation):
Les indicateurs du développement mondiale
Source (organisation):
Development Assistance Committee of the Organisation for Economic Co-operation and Development, Geographical Distribution of Financial Flows to Developing Countries, Development Co-operation Report, and International Development Statistics database. Data are available online at: www.oecd.org/dac/stats/idsonline.
Catégories:
Aid Effectiveness
Dernière mise à jour
23 avr. 2017
Les indicateurs de changement de valeurs selon les années
Minimum:
3.314 mds
1 janv. 1961
Maximum:
47.947 mds
1 janv. 2014
Pour la date d''observation
Valeur
Changement absolu
Le changement par rapport à la valeur précédente
1 janv. 1961
3.314 mds
+3.314 mds
0.0%
1 janv. 1962
4.307 mds
+993.03 mln.
29.96%
1 janv. 1963
4.578 mds
+271.08 mln.
6.29%
1 janv. 1964
4.546 mds
-32.01 mln.
-0.7%
1 janv. 1965
5.835 mds
+1.289 mds
28.34%
1 janv. 1966
6.23 mds
+394.81 mln.
6.77%
1 janv. 1967
6.262 mds
+32.46 mln.
0.52%
1 janv. 1968
6.109 mds
-153.03 mln.
-2.44%
1 janv. 1969
5.435 mds
-674.56 mln.
-11.04%
1 janv. 1970
5.235 mds
-199.26 mln.
-3.67%
1 janv. 1971
5.066 mds
-169.19 mln.
-3.23%
1 janv. 1972
5.843 mds
+777.07 mln.
15.34%
1 janv. 1973
7.416 mds
+1.573 mds
26.92%
1 janv. 1974
9.958 mds
+2.542 mds
34.27%
1 janv. 1975
14.197 mds
+4.239 mds
42.57%
1 janv. 1976
16.553 mds
+2.356 mds
16.6%
1 janv. 1977
14.033 mds
-2.521 mds
-15.23%
1 janv. 1978
15.84 mds
+1.808 mds
12.88%
1 janv. 1979
18.071 mds
+2.23 mds
14.08%
1 janv. 1980
19.944 mds
+1.874 mds
10.37%
1 janv. 1981
21.054 mds
+1.11 mds
5.57%
1 janv. 1982
21.254 mds
+199.58 mln.
0.95%
1 janv. 1983
23.03 mds
+1.776 mds
8.36%
1 janv. 1984
21.763 mds
-1.268 mds
-5.51%
1 janv. 1985
23.313 mds
+1.55 mds
7.12%
1 janv. 1986
25.631 mds
+2.318 mds
9.94%
1 janv. 1987
25.027 mds
-604.58 mln.
-2.36%
1 janv. 1988
25.069 mds
+42.04 mln.
0.17%
1 janv. 1989
24.697 mds
-371.45 mln.
-1.48%
1 janv. 1990
25.447 mds
+749.86 mln.
3.04%
1 janv. 1991
26.451 mds
+1.004 mds
3.94%
1 janv. 1992
25.396 mds
-1.055 mds
-3.99%
1 janv. 1993
24.937 mds
-459.13 mln.
-1.81%
1 janv. 1994
23.361 mds
-1.576 mds
-6.32%
1 janv. 1995
24.173 mds
+812.28 mln.
3.48%
1 janv. 1996
22.334 mds
-1.839 mds
-7.61%
1 janv. 1997
18.883 mds
-3.451 mds
-15.45%
1 janv. 1998
19.216 mds
+333.51 mln.
1.77%
1 janv. 1999
18.987 mds
-229.64 mln.
-1.2%
1 janv. 2000
18.505 mds
-481.51 mln.
-2.54%
1 janv. 2001
19.698 mds
+1.193 mds
6.44%
1 janv. 2002
22.78 mds
+3.082 mds
15.65%
1 janv. 2003
27.564 mds
+4.784 mds
21.0%
1 janv. 2004
32.517 mds
+4.952 mds
17.97%
1 janv. 2005
31.37 mds
-1.147 mds
-3.53%
1 janv. 2006
30.943 mds
-426.94 mln.
-1.36%
1 janv. 2007
33.483 mds
+2.54 mds
8.21%
1 janv. 2008
36.475 mds
+2.992 mds
8.94%
1 janv. 2009
39.983 mds
+3.508 mds
9.62%
1 janv. 2010
42.5 mds
+2.516 mds
6.29%
1 janv. 2011
46.19 mds
+3.69 mds
8.68%
1 janv. 2012
44.579 mds
-1.611 mds
-3.49%
1 janv. 2013
42.847 mds
-1.732 mds
-3.88%
1 janv. 2014
47.947 mds
+5.1 mds
11.9%
1 janv. 2015
43.494 mds
-4.454 mds
-9.29%
Classement des pays selon les statistiques actuelles par années


Commentaires: