29
/fr/
fr
AIzaSyAYiBZKx7MnpbEhh9jyipgxe19OcubqV5w
April 1, 2024
43276
Latin America & the Caribbean (IDA & IBRD countries)
TLA
false
2
1
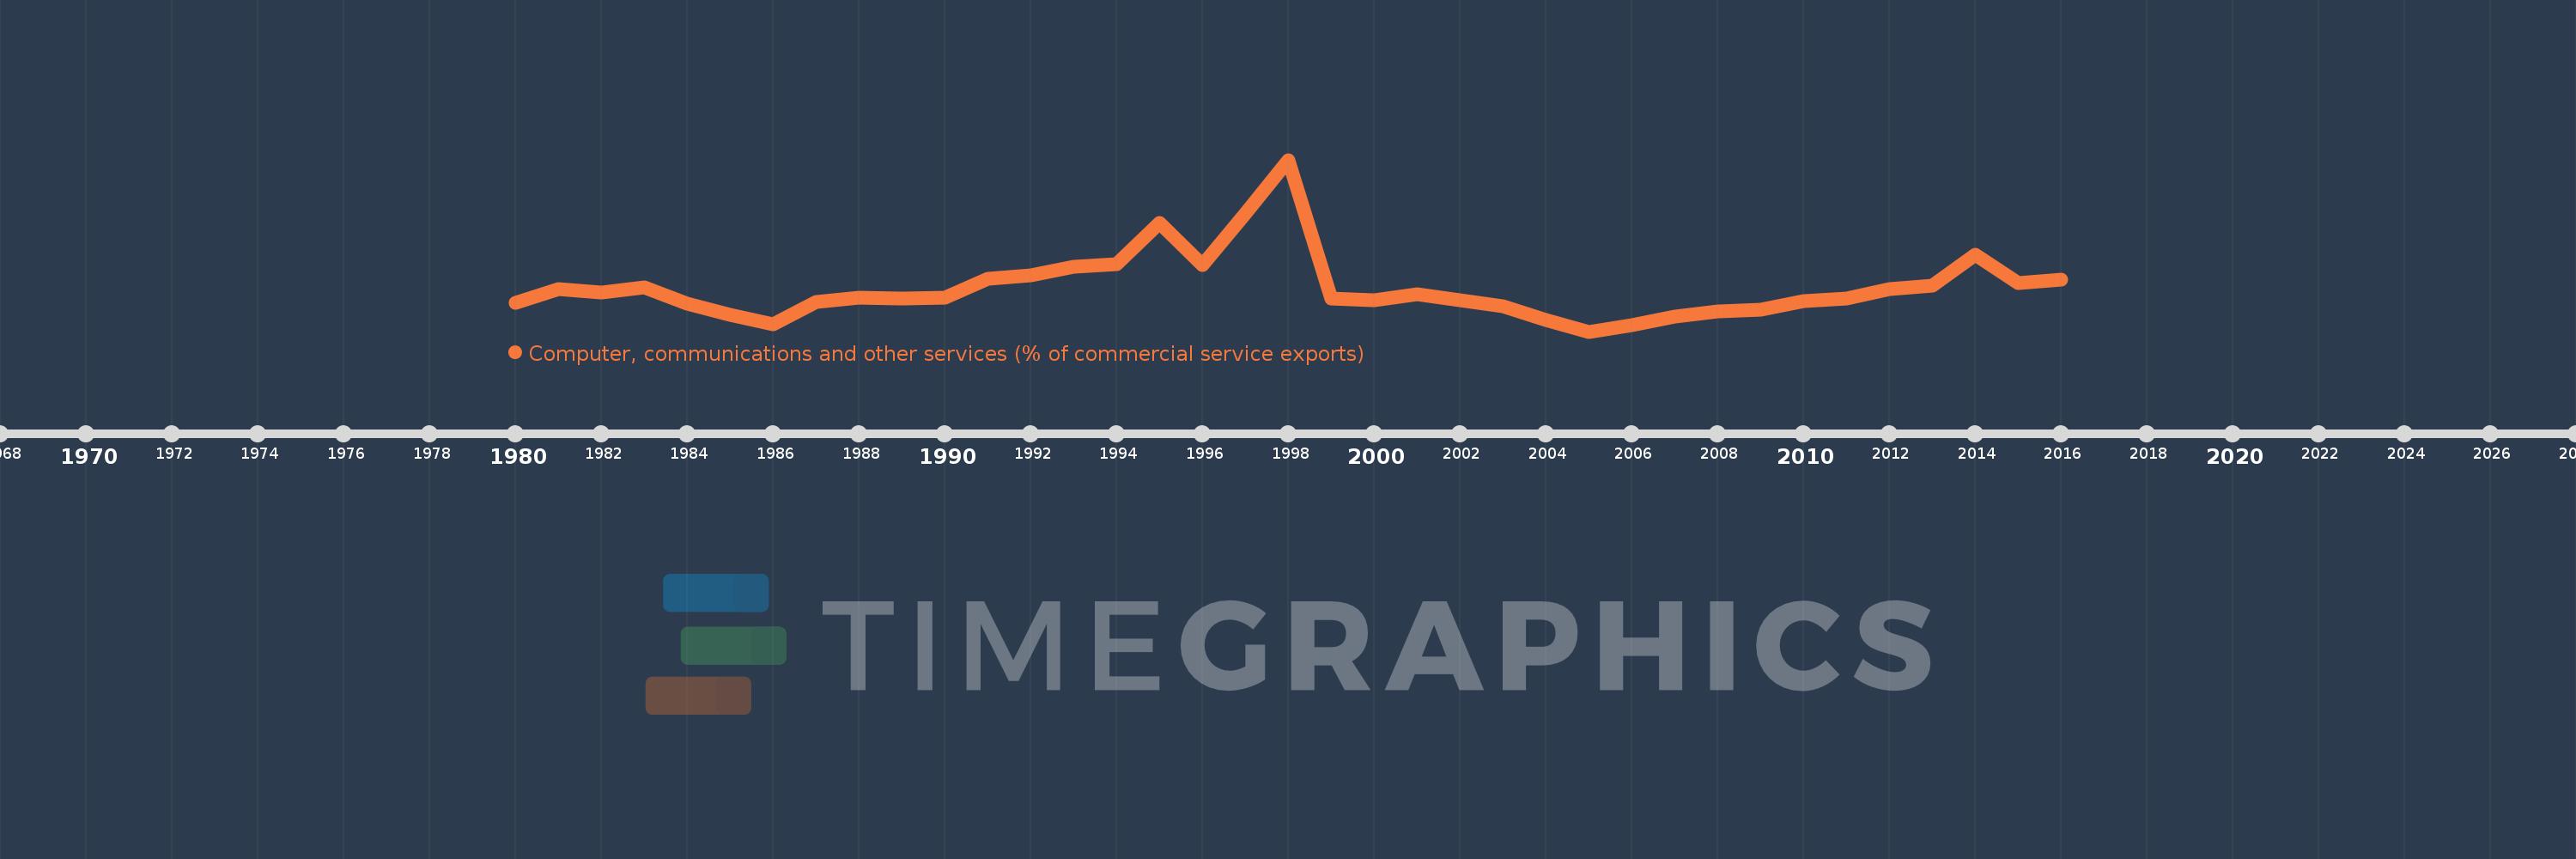
Computer, communications and other services (% of commercial service exports)
2016,2015,2014,2013,2012,2011,2010,2009,2008,2007,2006,2005,2004,2003,2002,2001,2000,1999,1998,1997,1996,1995,1994,1993,1992,1991,1990,1989,1988,1987,1986,1985,1984,1983,1982,1981,1980
Cette statistique dans les autres pays:
AfghanistanAlbaniaAlgeriaAngolaAntigua and BarbudaArab WorldArgentinaArmeniaArubaAustraliaAustriaAzerbaijanBahamas, TheBahrainBangladeshBarbadosBelarusBelgiumBelizeBeninBermudaBhutanBoliviaBosnia and HerzegovinaBotswanaBrazilBrunei DarussalamBulgariaBurkina FasoBurundiCabo VerdeCambodiaCameroonCanadaCaribbean small statesCentral African RepublicCentral Europe and the BalticsChadChileChinaColombiaComorosCongo, Dem. Rep.Congo, Rep.Costa RicaCote d'IvoireCroatiaCuracaoCyprusCzech RepublicDenmarkDjiboutiDominicaDominican RepublicEarly-demographic dividendEast Asia & PacificEast Asia & Pacific (excluding high income)East Asia & Pacific (IDA & IBRD countries)EcuadorEgypt, Arab Rep.El SalvadorEritreaEstoniaEthiopiaEuro areaEurope & Central AsiaEurope & Central Asia (excluding high income)Europe & Central Asia (IDA & IBRD countries)European UnionFaroe IslandsFijiFinlandFragile and conflict affected situationsFranceFrench PolynesiaGabonGambia, TheGeorgiaGermanyGhanaGreeceGrenadaGuatemalaGuineaGuinea-BissauGuyanaHaitiHeavily indebted poor countries (HIPC)High incomeHondurasHong Kong SAR, ChinaHungaryIBRD onlyIcelandIDA & IBRD totalIDA onlyIDA totalIndiaIndonesiaIran, Islamic Rep.IraqIrelandIsraelItalyJamaicaJapanJordanKazakhstanKenyaKiribatiKorea, Rep.KosovoKuwaitKyrgyz RepublicLao PDRLate-demographic dividendLatin America & Caribbean Latin America & Caribbean (excluding high income)Latin America & the Caribbean (IDA & IBRD countries)LatviaLeast developed countries: UN classificationLebanonLesothoLiberiaLibyaLithuaniaLow & middle incomeLow incomeLower middle incomeLuxembourgMacao SAR, ChinaMacedonia, FYRMadagascarMalawiMalaysiaMaldivesMaliMaltaMarshall IslandsMauritaniaMauritiusMexicoMicronesia, Fed. Sts.Middle East & North AfricaMiddle East & North Africa (excluding high income)Middle East & North Africa (IDA & IBRD countries)Middle incomeMoldovaMongoliaMontenegroMoroccoMozambiqueMyanmarNamibiaNepalNetherlandsNew CaledoniaNew ZealandNicaraguaNigerNigeriaNorth AmericaNorwayOECD membersOmanOther small statesPacific island small statesPakistanPalauPanamaPapua New GuineaParaguayPeruPhilippinesPolandPortugalPost-demographic dividendPre-demographic dividendQatarRomaniaRussian FederationRwandaSamoaSao Tome and PrincipeSaudi ArabiaSenegalSerbiaSeychellesSierra LeoneSingaporeSint Maarten (Dutch part)Slovak RepublicSloveniaSmall statesSolomon IslandsSouth AfricaSouth AsiaSouth Asia (IDA & IBRD)South SudanSpainSri LankaSt. Kitts and NevisSt. LuciaSt. Vincent and the GrenadinesSub-Saharan Africa Sub-Saharan Africa (excluding high income)Sub-Saharan Africa (IDA & IBRD countries)SudanSurinameSwazilandSwedenSwitzerlandSyrian Arab RepublicTajikistanTanzaniaThailandTimor-LesteTogoTongaTrinidad and TobagoTunisiaTurkeyTuvaluUgandaUkraineUnited KingdomUnited StatesUpper middle incomeUruguayVanuatuVenezuela, RBWest Bank and GazaWorldYemen, Rep.ZambiaZimbabwe La ligne de temps
Cette échelle de temps montre un graphique de 1980 année à 2016 année Latin America & the Caribbean (IDA & IBRD countries). Les données jusqu'à 1979 année ne sont pas présentés. Quantité d'observations actuelles selon dates: 37.
Source (désignation):
Les indicateurs du développement mondiale
Source (organisation):
International Monetary Fund, Balance of Payments Statistics Yearbook and data files.
Catégories:
Private Sector, Trade
Dernière mise à jour
23 avr. 2017
Les indicateurs de changement de valeurs selon les années
Minimum:
21.062
1 janv. 2005
Maximum:
37.84
1 janv. 1998
Pour la date d''observation
Valeur
Changement absolu
Le changement par rapport à la valeur précédente
1 janv. 1980
23.849
+23.849
0.0%
1 janv. 1981
25.211
+1.363
5.71%
1 janv. 1982
24.87
-0.341
-1.35%
1 janv. 1983
25.382
+0.512
2.06%
1 janv. 1984
23.824
-1.558
-6.14%
1 janv. 1985
22.66
-1.164
-4.89%
1 janv. 1986
21.744
-0.915
-4.04%
1 janv. 1987
23.937
+2.192
10.08%
1 janv. 1988
24.35
+0.413
1.73%
1 janv. 1989
24.282
-0.068
-0.28%
1 janv. 1990
24.335
+0.053
0.22%
1 janv. 1991
26.247
+1.912
7.86%
1 janv. 1992
26.543
+0.296
1.13%
1 janv. 1993
27.382
+0.839
3.16%
1 janv. 1994
27.638
+0.256
0.93%
1 janv. 1995
31.673
+4.035
14.6%
1 janv. 1996
27.552
-4.121
-13.01%
1 janv. 1997
32.596
+5.044
18.31%
1 janv. 1998
37.84
+5.244
16.09%
1 janv. 1999
24.318
-13.522
-35.73%
1 janv. 2000
24.137
-0.181
-0.75%
1 janv. 2001
24.748
+0.611
2.53%
1 janv. 2002
24.112
-0.636
-2.57%
1 janv. 2003
23.496
-0.616
-2.56%
1 janv. 2004
22.204
-1.292
-5.5%
1 janv. 2005
21.062
-1.142
-5.14%
1 janv. 2006
21.685
+0.623
2.96%
1 janv. 2007
22.522
+0.837
3.86%
1 janv. 2008
23.019
+0.497
2.21%
1 janv. 2009
23.172
+0.153
0.66%
1 janv. 2010
24.008
+0.836
3.61%
1 janv. 2011
24.261
+0.253
1.06%
1 janv. 2012
25.226
+0.965
3.98%
1 janv. 2013
25.511
+0.285
1.13%
1 janv. 2014
28.546
+3.035
11.9%
1 janv. 2015
25.814
-2.732
-9.57%
1 janv. 2016
26.168
+0.354
1.37%
Classement des pays selon les statistiques actuelles par années


Commentaires: