29
/fr/
fr
AIzaSyAYiBZKx7MnpbEhh9jyipgxe19OcubqV5w
April 1, 2024
43019
Latin America & Caribbean (excluding high income)
LAC
false
2
1
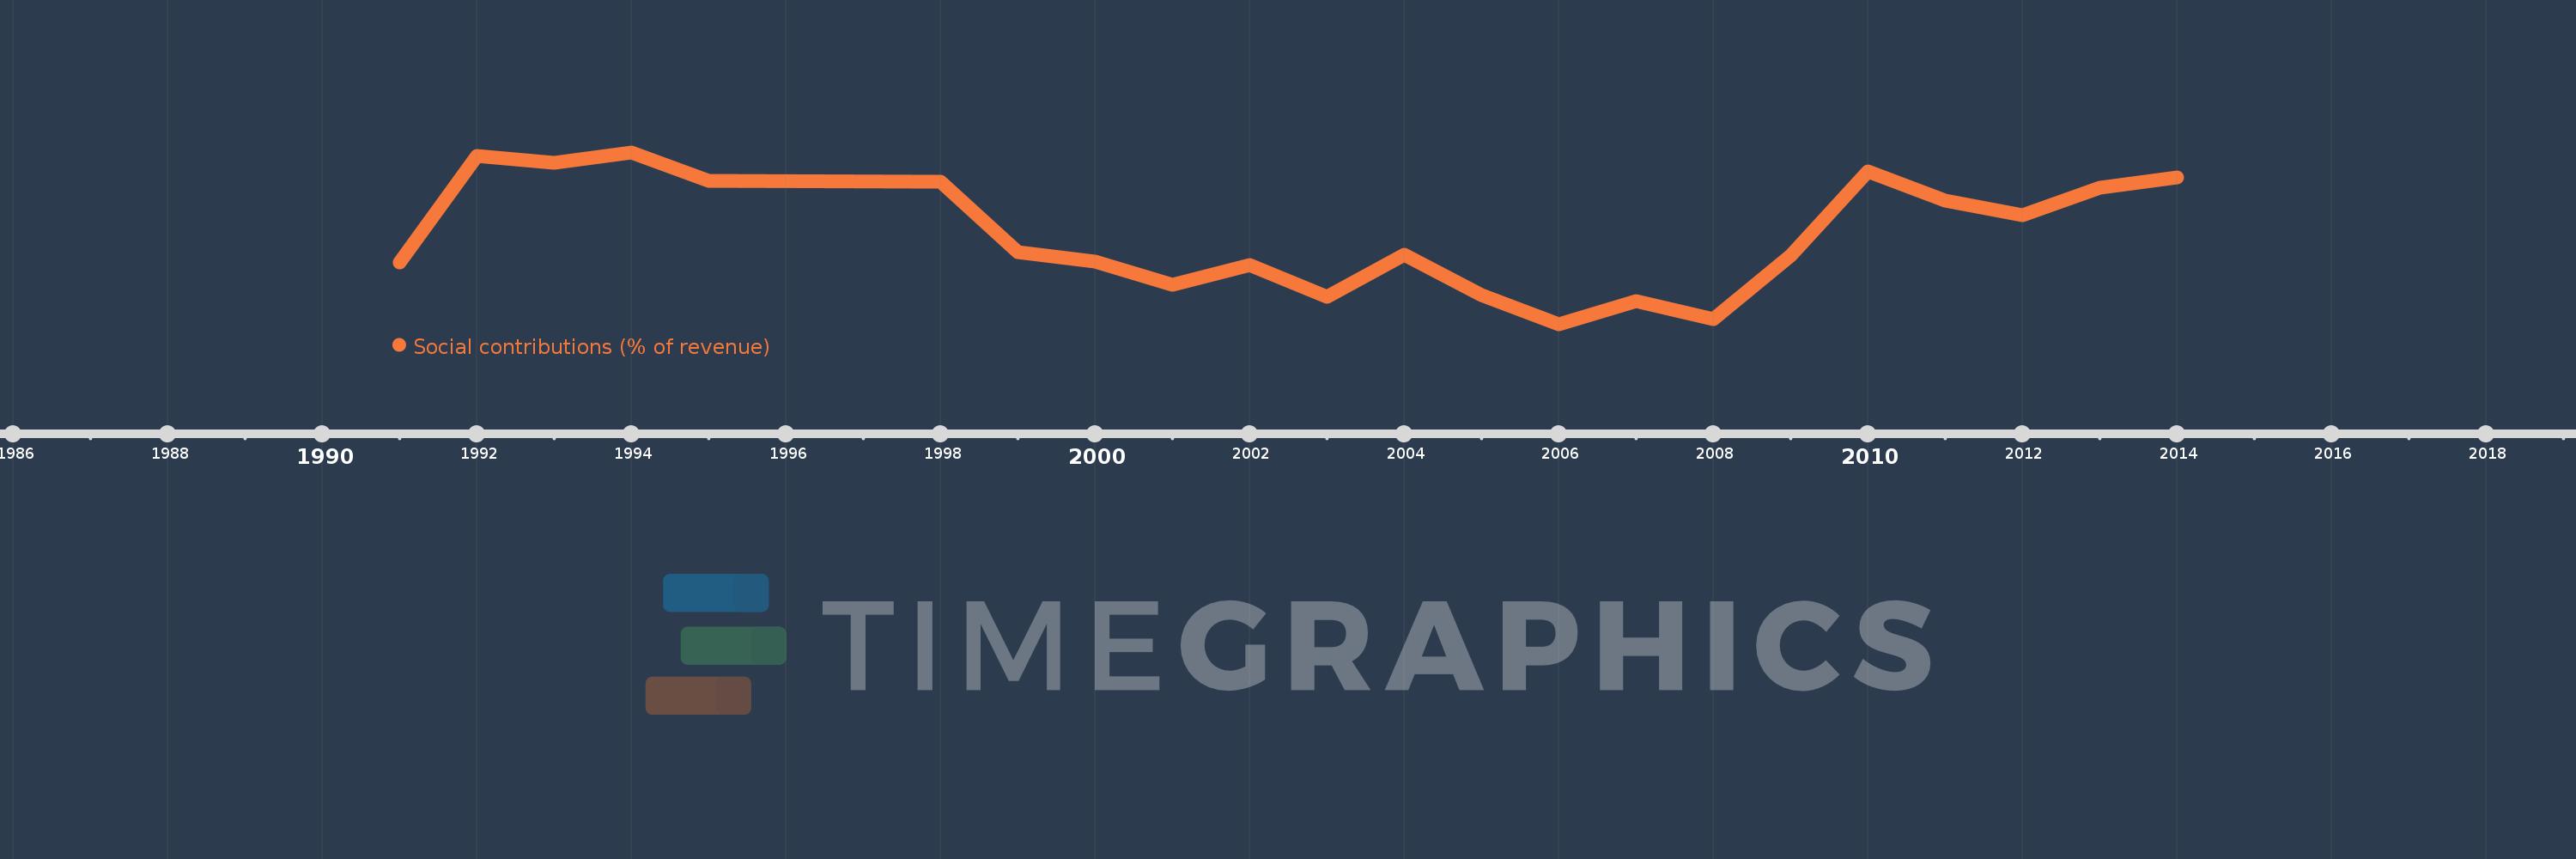
Social contributions (% of revenue)
2014,2013,2012,2011,2010,2009,2008,2007,2006,2005,2004,2003,2002,2001,2000,1999,1998,1995,1994,1993,1992,1991
Cette statistique dans les autres pays:
La ligne de temps
Cette échelle de temps montre un graphique de 1991 année à 2014 année Latin America & Caribbean (excluding high income). Les données jusqu'à 1990 année ne sont pas présentés. Quantité d'observations actuelles selon dates: 22.
Source (désignation):
Les indicateurs du développement mondiale
Source (organisation):
International Monetary Fund, Government Finance Statistics Yearbook and data files.
Catégories:
Public Sector
Dernière mise à jour
23 avr. 2017
Les indicateurs de changement de valeurs selon les années
Minimum:
8.672
1 janv. 2006
Maximum:
13.379
1 janv. 1994
Pour la date d''observation
Valeur
Changement absolu
Le changement par rapport à la valeur précédente
1 janv. 1991
10.358
+10.358
0.0%
1 janv. 1992
13.285
+2.927
28.26%
1 janv. 1993
13.09
-0.194
-1.46%
1 janv. 1994
13.379
+0.289
2.2%
1 janv. 1995
12.602
-0.778
-5.81%
1 janv. 1998
12.585
-0.017
-0.13%
1 janv. 1999
10.657
-1.927
-15.32%
1 janv. 2000
10.396
-0.262
-2.45%
1 janv. 2001
9.764
-0.632
-6.08%
1 janv. 2002
10.294
+0.53
5.43%
1 janv. 2003
9.424
-0.87
-8.45%
1 janv. 2004
10.583
+1.159
12.3%
1 janv. 2005
9.47
-1.113
-10.52%
1 janv. 2006
8.672
-0.799
-8.43%
1 janv. 2007
9.302
+0.63
7.27%
1 janv. 2008
8.81
-0.492
-5.29%
1 janv. 2009
10.561
+1.751
19.87%
1 janv. 2010
12.848
+2.287
21.66%
1 janv. 2011
12.05
-0.798
-6.21%
1 janv. 2012
11.661
-0.389
-3.23%
1 janv. 2013
12.414
+0.752
6.45%
1 janv. 2014
12.704
+0.29
2.34%
Classement des pays selon les statistiques actuelles par années


Commentaires: