29
/fr/
fr
AIzaSyAYiBZKx7MnpbEhh9jyipgxe19OcubqV5w
April 1, 2024
42425
Latin America & Caribbean (excluding high income)
LAC
false
2
1
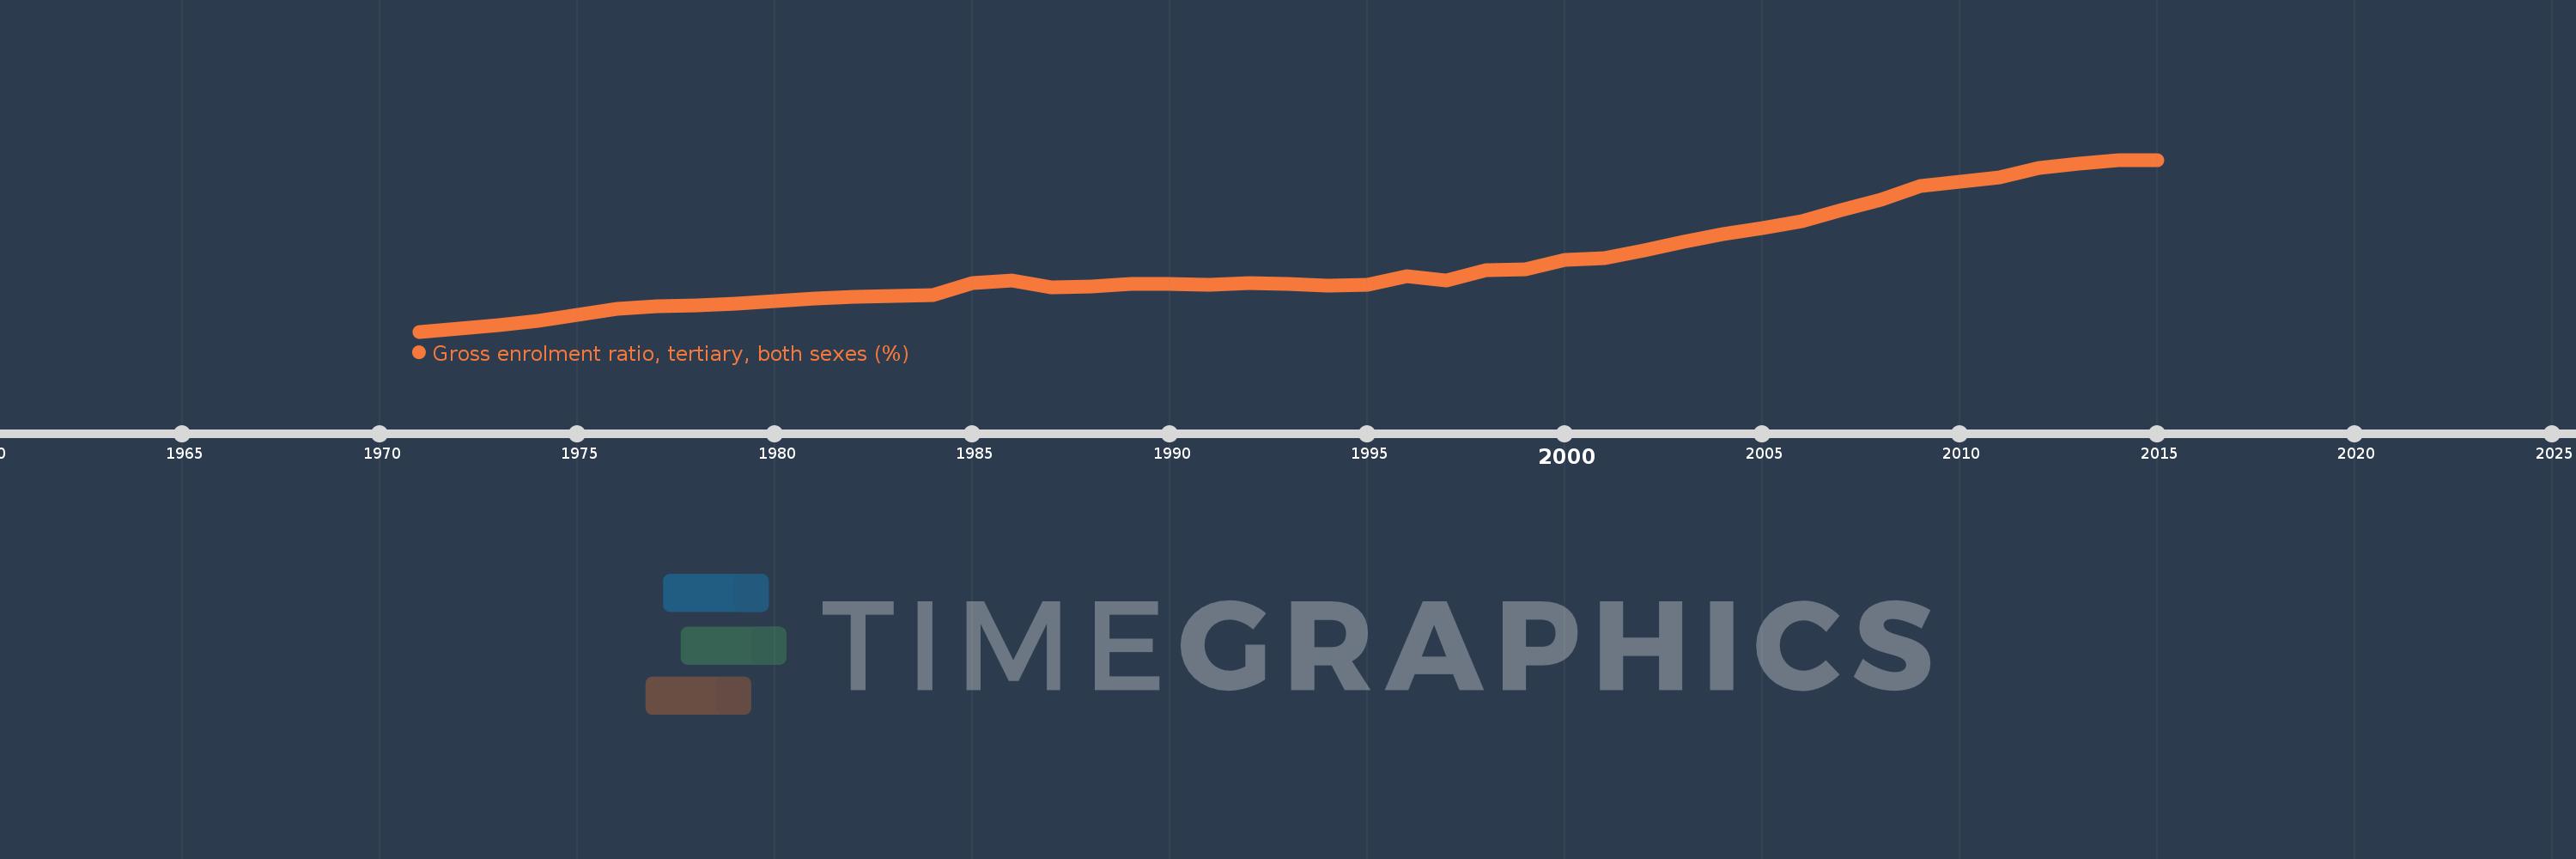
Gross enrolment ratio, tertiary, both sexes (%)
2015,2014,2013,2012,2011,2010,2009,2008,2007,2006,2005,2004,2003,2002,2001,2000,1999,1998,1997,1996,1995,1994,1993,1992,1991,1990,1989,1988,1987,1986,1985,1984,1983,1982,1981,1980,1979,1978,1977,1976,1975,1974,1973,1972,1971
Cette statistique dans les autres pays:
AfghanistanAlbaniaAlgeriaAngolaAntigua and BarbudaArab WorldArgentinaArmeniaArubaAustraliaAustriaAzerbaijanBahamas, TheBahrainBangladeshBarbadosBelarusBelgiumBelizeBeninBermudaBhutanBoliviaBosnia and HerzegovinaBotswanaBrazilBritish Virgin IslandsBrunei DarussalamBulgariaBurkina FasoBurundiCabo VerdeCambodiaCameroonCanadaCaribbean small statesCentral African RepublicCentral Europe and the BalticsChadChileChinaColombiaComorosCongo, Dem. Rep.Congo, Rep.Costa RicaCote d'IvoireCroatiaCubaCuracaoCyprusCzech RepublicDenmarkDjiboutiDominicaDominican RepublicEarly-demographic dividendEast Asia & PacificEast Asia & Pacific (excluding high income)East Asia & Pacific (IDA & IBRD countries)EcuadorEgypt, Arab Rep.El SalvadorEquatorial GuineaEritreaEstoniaEthiopiaEuro areaEurope & Central AsiaEurope & Central Asia (excluding high income)Europe & Central Asia (IDA & IBRD countries)European UnionFijiFinlandFragile and conflict affected situationsFranceGabonGambia, TheGeorgiaGermanyGhanaGreeceGrenadaGuatemalaGuineaGuinea-BissauGuyanaHaitiHeavily indebted poor countries (HIPC)High incomeHondurasHong Kong SAR, ChinaHungaryIBRD onlyIcelandIDA & IBRD totalIDA blendIDA onlyIDA totalIndiaIndonesiaIran, Islamic Rep.IraqIrelandIsraelItalyJamaicaJapanJordanKazakhstanKenyaKorea, Dem. People’s Rep.Korea, Rep.KuwaitKyrgyz RepublicLao PDRLate-demographic dividendLatin America & Caribbean Latin America & Caribbean (excluding high income)Latin America & the Caribbean (IDA & IBRD countries)LatviaLeast developed countries: UN classificationLebanonLesothoLiberiaLibyaLiechtensteinLithuaniaLow & middle incomeLow incomeLower middle incomeLuxembourgMacao SAR, ChinaMacedonia, FYRMadagascarMalawiMalaysiaMaldivesMaliMaltaMarshall IslandsMauritaniaMauritiusMexicoMicronesia, Fed. Sts.Middle East & North AfricaMiddle East & North Africa (excluding high income)Middle East & North Africa (IDA & IBRD countries)Middle incomeMoldovaMongoliaMontenegroMoroccoMozambiqueMyanmarNamibiaNepalNetherlandsNew ZealandNicaraguaNigerNigeriaNorth AmericaNorwayOECD membersOmanOther small statesPacific island small statesPakistanPalauPanamaPapua New GuineaParaguayPeruPhilippinesPolandPortugalPost-demographic dividendPre-demographic dividendPuerto RicoQatarRomaniaRussian FederationRwandaSamoaSan MarinoSao Tome and PrincipeSaudi ArabiaSenegalSerbiaSeychellesSierra LeoneSingaporeSlovak RepublicSloveniaSmall statesSomaliaSouth AfricaSouth AsiaSouth Asia (IDA & IBRD)SpainSri LankaSt. Kitts and NevisSt. LuciaSt. Vincent and the GrenadinesSub-Saharan Africa Sub-Saharan Africa (excluding high income)Sub-Saharan Africa (IDA & IBRD countries)SudanSurinameSwazilandSwedenSwitzerlandSyrian Arab RepublicTajikistanTanzaniaThailandTimor-LesteTogoTongaTrinidad and TobagoTunisiaTurkeyTurkmenistanUgandaUkraineUnited Arab EmiratesUnited KingdomUnited StatesUpper middle incomeUruguayUzbekistanVanuatuVenezuela, RBVietnamWest Bank and GazaWorldYemen, Rep.ZambiaZimbabwe La ligne de temps
Cette échelle de temps montre un graphique de 1971 année à 2015 année Latin America & Caribbean (excluding high income). Les données jusqu'à 1970 année ne sont pas présentés. Quantité d'observations actuelles selon dates: 45.
Source (désignation):
Les indicateurs du développement mondiale
Source (organisation):
UNESCO Institute for Statistics
Catégories:
Education
Dernière mise à jour
23 avr. 2017
Les indicateurs de changement de valeurs selon les années
Minimum:
5.956
1 janv. 1971
Maximum:
43.302
1 janv. 2015
Pour la date d''observation
Valeur
Changement absolu
Le changement par rapport à la valeur précédente
1 janv. 1971
5.956
+5.956
0.0%
1 janv. 1972
6.644
+0.688
11.56%
1 janv. 1973
7.418
+0.774
11.65%
1 janv. 1974
8.328
+0.91
12.27%
1 janv. 1975
9.581
+1.253
15.05%
1 janv. 1976
10.917
+1.337
13.95%
1 janv. 1977
11.385
+0.468
4.29%
1 janv. 1978
11.646
+0.261
2.29%
1 janv. 1979
12.052
+0.405
3.48%
1 janv. 1980
12.651
+0.6
4.97%
1 janv. 1981
13.121
+0.47
3.71%
1 janv. 1982
13.532
+0.411
3.13%
1 janv. 1983
13.694
+0.162
1.2%
1 janv. 1984
13.939
+0.245
1.79%
1 janv. 1985
16.458
+2.519
18.07%
1 janv. 1986
17.062
+0.604
3.67%
1 janv. 1987
15.574
-1.488
-8.72%
1 janv. 1988
15.816
+0.242
1.55%
1 janv. 1989
16.242
+0.426
2.69%
1 janv. 1990
16.279
+0.037
0.23%
1 janv. 1991
16.204
-0.075
-0.46%
1 janv. 1992
16.486
+0.282
1.74%
1 janv. 1993
16.257
-0.229
-1.39%
1 janv. 1994
15.998
-0.26
-1.6%
1 janv. 1995
16.096
+0.098
0.61%
1 janv. 1996
18.058
+1.963
12.19%
1 janv. 1997
16.979
-1.079
-5.97%
1 janv. 1998
19.272
+2.293
13.5%
1 janv. 1999
19.409
+0.136
0.71%
1 janv. 2000
21.61
+2.201
11.34%
1 janv. 2001
21.95
+0.34
1.58%
1 janv. 2002
23.594
+1.644
7.49%
1 janv. 2003
25.412
+1.818
7.71%
1 janv. 2004
27.109
+1.697
6.68%
1 janv. 2005
28.467
+1.357
5.01%
1 janv. 2006
29.956
+1.49
5.23%
1 janv. 2007
32.408
+2.451
8.18%
1 janv. 2008
34.528
+2.121
6.54%
1 janv. 2009
37.599
+3.07
8.89%
1 janv. 2010
38.622
+1.023
2.72%
1 janv. 2011
39.42
+0.799
2.07%
1 janv. 2012
41.607
+2.187
5.55%
1 janv. 2013
42.509
+0.901
2.17%
1 janv. 2014
43.202
+0.694
1.63%
1 janv. 2015
43.302
+0.1
0.23%
Classement des pays selon les statistiques actuelles par années


Commentaires: