29
/fr/
fr
AIzaSyAYiBZKx7MnpbEhh9jyipgxe19OcubqV5w
April 1, 2024
42073
Latin America & Caribbean (excluding high income)
LAC
false
2
1
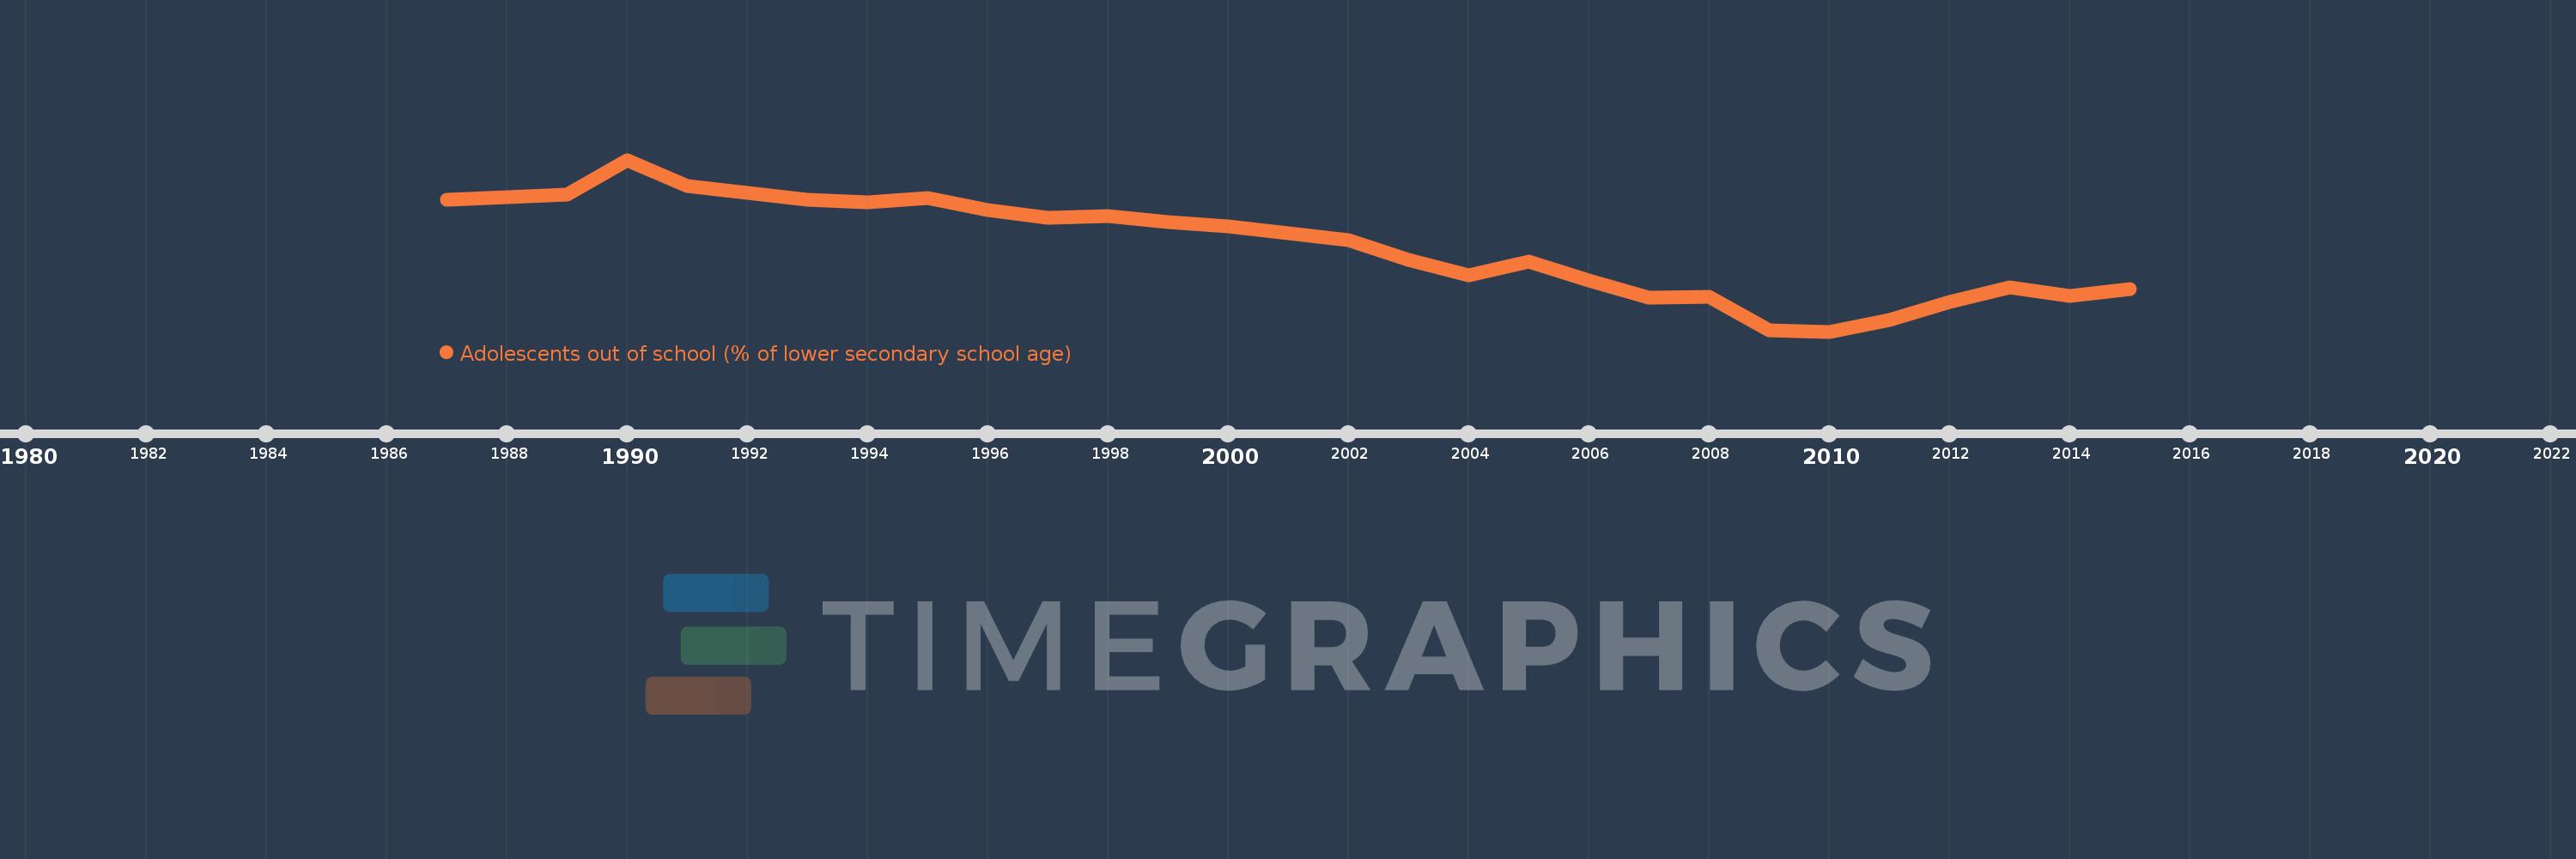
Adolescents out of school (% of lower secondary school age)
2015,2014,2013,2012,2011,2010,2009,2008,2007,2006,2005,2004,2003,2002,2001,2000,1999,1998,1997,1996,1995,1994,1993,1992,1991,1990,1989,1988,1987
Cette statistique dans les autres pays:
AfghanistanAlbaniaAlgeriaAngolaAntigua and BarbudaArab WorldArgentinaArmeniaArubaAustraliaAustriaAzerbaijanBahamas, TheBahrainBangladeshBarbadosBelarusBelgiumBelizeBeninBermudaBhutanBoliviaBotswanaBrazilBrunei DarussalamBulgariaBurkina FasoBurundiCabo VerdeCambodiaCameroonCanadaCaribbean small statesCentral African RepublicCentral Europe and the BalticsChadChileColombiaComorosCongo, Dem. Rep.Congo, Rep.Costa RicaCroatiaCubaCyprusDenmarkDjiboutiDominicaDominican RepublicEarly-demographic dividendEast Asia & PacificEast Asia & Pacific (excluding high income)East Asia & Pacific (IDA & IBRD countries)EcuadorEgypt, Arab Rep.El SalvadorEquatorial GuineaEritreaEstoniaEthiopiaEuro areaEurope & Central AsiaEurope & Central Asia (excluding high income)Europe & Central Asia (IDA & IBRD countries)European UnionFijiFinlandFragile and conflict affected situationsFranceGambia, TheGeorgiaGhanaGreeceGrenadaGuatemalaGuineaGuinea-BissauGuyanaHeavily indebted poor countries (HIPC)High incomeHondurasHong Kong SAR, ChinaHungaryIBRD onlyIcelandIDA & IBRD totalIDA blendIDA onlyIDA totalIndiaIndonesiaIran, Islamic Rep.IraqIrelandIsraelItalyJamaicaJapanJordanKazakhstanKenyaKiribatiKorea, Dem. People’s Rep.Korea, Rep.KuwaitKyrgyz RepublicLao PDRLate-demographic dividendLatin America & Caribbean Latin America & Caribbean (excluding high income)Latin America & the Caribbean (IDA & IBRD countries)LatviaLeast developed countries: UN classificationLebanonLesothoLibyaLiechtensteinLithuaniaLow & middle incomeLow incomeLower middle incomeLuxembourgMacao SAR, ChinaMacedonia, FYRMadagascarMalawiMalaysiaMaldivesMaliMaltaMarshall IslandsMauritaniaMauritiusMexicoMiddle East & North AfricaMiddle East & North Africa (excluding high income)Middle East & North Africa (IDA & IBRD countries)Middle incomeMoldovaMongoliaMoroccoMozambiqueMyanmarNamibiaNauruNetherlandsNew ZealandNicaraguaNigerNorth AmericaNorwayOECD membersOmanOther small statesPacific island small statesPakistanPanamaParaguayPeruPhilippinesPolandPortugalPost-demographic dividendPre-demographic dividendPuerto RicoQatarRomaniaRussian FederationSamoaSao Tome and PrincipeSaudi ArabiaSenegalSerbiaSeychellesSierra LeoneSloveniaSmall statesSolomon IslandsSomaliaSouth AfricaSouth AsiaSouth Asia (IDA & IBRD)SpainSri LankaSt. Kitts and NevisSt. LuciaSt. Vincent and the GrenadinesSub-Saharan Africa Sub-Saharan Africa (excluding high income)Sub-Saharan Africa (IDA & IBRD countries)SudanSurinameSwazilandSwedenSwitzerlandSyrian Arab RepublicTajikistanThailandTimor-LesteTogoTongaTrinidad and TobagoTunisiaTurkeyTuvaluUgandaUkraineUnited Arab EmiratesUnited KingdomUnited StatesUpper middle incomeUruguayUzbekistanVanuatuVenezuela, RBVietnamWest Bank and GazaWorldYemen, Rep.Zimbabwe La ligne de temps
Cette échelle de temps montre un graphique de 1987 année à 2015 année Latin America & Caribbean (excluding high income). Les données jusqu'à 1986 année ne sont pas présentés. Quantité d'observations actuelles selon dates: 29.
Source (désignation):
Les indicateurs du développement mondiale
Source (organisation):
United Nations Educational, Scientific, and Cultural Organization (UNESCO) Institute for Statistics.
Catégories:
Education
Dernière mise à jour
23 avr. 2017
Les indicateurs de changement de valeurs selon les années
Minimum:
5.571
1 janv. 2010
Maximum:
14.08
1 janv. 1990
Pour la date d''observation
Valeur
Changement absolu
Le changement par rapport à la valeur précédente
1 janv. 1987
12.084
+12.084
0.0%
1 janv. 1988
12.237
+0.153
1.27%
1 janv. 1989
12.374
+0.137
1.12%
1 janv. 1990
14.08
+1.706
13.79%
1 janv. 1991
12.776
-1.304
-9.26%
1 janv. 1992
12.446
-0.33
-2.58%
1 janv. 1993
12.112
-0.335
-2.69%
1 janv. 1994
11.979
-0.132
-1.09%
1 janv. 1995
12.183
+0.203
1.7%
1 janv. 1996
11.606
-0.576
-4.73%
1 janv. 1997
11.219
-0.387
-3.34%
1 janv. 1998
11.276
+0.056
0.5%
1 janv. 1999
10.982
-0.294
-2.61%
1 janv. 2000
10.786
-0.195
-1.78%
1 janv. 2001
10.433
-0.354
-3.28%
1 janv. 2002
10.083
-0.349
-3.35%
1 janv. 2003
9.124
-0.959
-9.51%
1 janv. 2004
8.348
-0.776
-8.51%
1 janv. 2005
9.031
+0.683
8.18%
1 janv. 2006
8.089
-0.942
-10.43%
1 janv. 2007
7.256
-0.833
-10.3%
1 janv. 2008
7.275
+0.02
0.27%
1 janv. 2009
5.646
-1.629
-22.4%
1 janv. 2010
5.571
-0.075
-1.32%
1 janv. 2011
6.131
+0.56
10.05%
1 janv. 2012
7.058
+0.927
15.11%
1 janv. 2013
7.772
+0.715
10.13%
1 janv. 2014
7.322
-0.451
-5.8%
1 janv. 2015
7.678
+0.357
4.87%
Classement des pays selon les statistiques actuelles par années


Commentaires: