29
/fr/
fr
AIzaSyAYiBZKx7MnpbEhh9jyipgxe19OcubqV5w
April 1, 2024
41982
Latin America & Caribbean
LCN
false
2
1
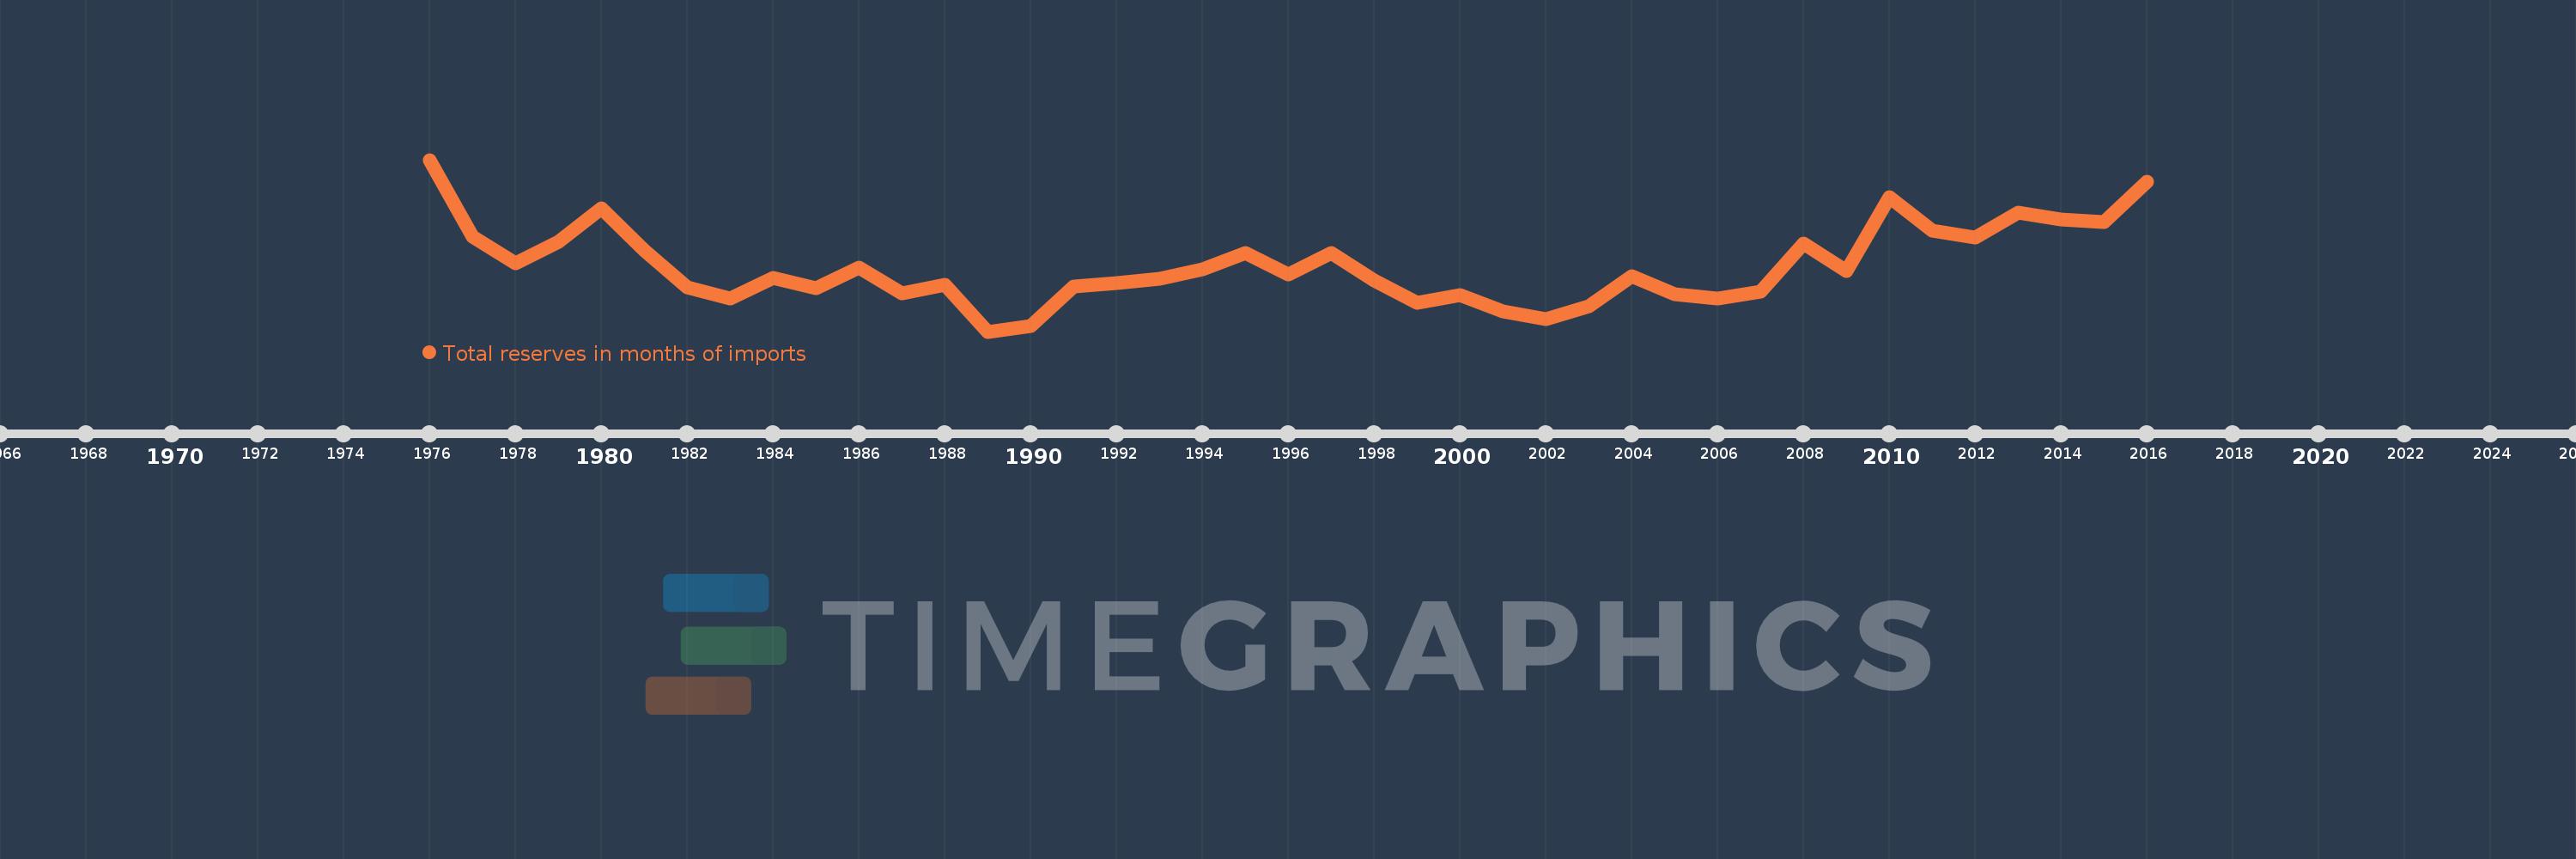
Total reserves in months of imports
2016,2015,2014,2013,2012,2011,2010,2009,2008,2007,2006,2005,2004,2003,2002,2001,2000,1999,1998,1997,1996,1995,1994,1993,1992,1991,1990,1989,1988,1987,1986,1985,1984,1983,1982,1981,1980,1979,1978,1977,1976
Cette statistique dans les autres pays:
AfghanistanAlbaniaAlgeriaAngolaAntigua and BarbudaArab WorldArgentinaArmeniaArubaAustraliaAustriaAzerbaijanBahamas, TheBahrainBangladeshBarbadosBelarusBelgiumBelizeBeninBhutanBoliviaBosnia and HerzegovinaBotswanaBrazilBrunei DarussalamBulgariaBurkina FasoBurundiCabo VerdeCambodiaCameroonCanadaCaribbean small statesCentral African RepublicCentral Europe and the BalticsChadChileChinaColombiaComorosCongo, Dem. Rep.Congo, Rep.Costa RicaCote d'IvoireCroatiaCuracaoCyprusCzech RepublicDenmarkDjiboutiDominicaDominican RepublicEarly-demographic dividendEast Asia & PacificEast Asia & Pacific (excluding high income)East Asia & Pacific (IDA & IBRD countries)EcuadorEgypt, Arab Rep.El SalvadorEquatorial GuineaEritreaEstoniaEthiopiaEuro areaEurope & Central AsiaEurope & Central Asia (excluding high income)Europe & Central Asia (IDA & IBRD countries)European UnionFijiFinlandFragile and conflict affected situationsFranceGabonGambia, TheGeorgiaGermanyGhanaGreeceGrenadaGuatemalaGuineaGuinea-BissauGuyanaHaitiHeavily indebted poor countries (HIPC)High incomeHondurasHong Kong SAR, ChinaHungaryIBRD onlyIcelandIDA & IBRD totalIDA blendIDA onlyIDA totalIndiaIndonesiaIran, Islamic Rep.IraqIrelandIsraelItalyJamaicaJapanJordanKazakhstanKenyaKorea, Rep.KosovoKuwaitKyrgyz RepublicLao PDRLate-demographic dividendLatin America & Caribbean Latin America & Caribbean (excluding high income)Latin America & the Caribbean (IDA & IBRD countries)LatviaLeast developed countries: UN classificationLebanonLesothoLiberiaLibyaLithuaniaLow & middle incomeLow incomeLower middle incomeLuxembourgMacao SAR, ChinaMacedonia, FYRMadagascarMalawiMalaysiaMaldivesMaliMaltaMauritaniaMauritiusMexicoMicronesia, Fed. Sts.Middle East & North AfricaMiddle East & North Africa (excluding high income)Middle East & North Africa (IDA & IBRD countries)Middle incomeMoldovaMongoliaMontenegroMoroccoMozambiqueMyanmarNamibiaNepalNetherlandsNicaraguaNigerNigeriaNorth AmericaNorwayOECD membersOmanOther small statesPacific island small statesPakistanPanamaPapua New GuineaParaguayPeruPhilippinesPolandPortugalPost-demographic dividendPre-demographic dividendQatarRomaniaRussian FederationRwandaSamoaSao Tome and PrincipeSaudi ArabiaSenegalSerbiaSeychellesSierra LeoneSingaporeSlovak RepublicSloveniaSmall statesSolomon IslandsSouth AfricaSouth AsiaSouth Asia (IDA & IBRD)South SudanSpainSri LankaSt. Kitts and NevisSt. LuciaSt. Vincent and the GrenadinesSub-Saharan Africa Sub-Saharan Africa (excluding high income)Sub-Saharan Africa (IDA & IBRD countries)SudanSurinameSwazilandSwedenSwitzerlandSyrian Arab RepublicTajikistanTanzaniaThailandTimor-LesteTogoTongaTrinidad and TobagoTunisiaTurkeyUgandaUkraineUnited KingdomUnited StatesUpper middle incomeUruguayVanuatuVenezuela, RBVietnamWest Bank and GazaWorldYemen, Rep.ZambiaZimbabwe La ligne de temps
Cette échelle de temps montre un graphique de 1976 année à 2016 année Latin America & Caribbean . Les données jusqu'à 1975 année ne sont pas présentés. Quantité d'observations actuelles selon dates: 41.
Source (désignation):
Les indicateurs du développement mondiale
Source (organisation):
International Monetary Fund, International Financial Statistics and data files.
Catégories:
Financial Sector, External Debt
Dernière mise à jour
23 avr. 2017
Les indicateurs de changement de valeurs selon les années
Minimum:
4.119
1 janv. 1989
Maximum:
10.926
1 janv. 1976
Pour la date d''observation
Valeur
Changement absolu
Le changement par rapport à la valeur précédente
1 janv. 1976
10.926
+10.926
0.0%
1 janv. 1977
7.884
-3.042
-27.84%
1 janv. 1978
6.822
-1.062
-13.47%
1 janv. 1979
7.686
+0.864
12.66%
1 janv. 1980
9.005
+1.319
17.17%
1 janv. 1981
7.334
-1.671
-18.55%
1 janv. 1982
5.864
-1.47
-20.05%
1 janv. 1983
5.421
-0.443
-7.55%
1 janv. 1984
6.249
+0.828
15.27%
1 janv. 1985
5.821
-0.428
-6.85%
1 janv. 1986
6.67
+0.849
14.59%
1 janv. 1987
5.628
-1.041
-15.61%
1 janv. 1988
5.963
+0.335
5.95%
1 janv. 1989
4.119
-1.844
-30.92%
1 janv. 1990
4.332
+0.213
5.17%
1 janv. 1991
5.891
+1.559
35.98%
1 janv. 1992
6.054
+0.163
2.77%
1 janv. 1993
6.228
+0.174
2.88%
1 janv. 1994
6.602
+0.374
6.0%
1 janv. 1995
7.231
+0.629
9.52%
1 janv. 1996
6.374
-0.856
-11.84%
1 janv. 1997
7.249
+0.875
13.73%
1 janv. 1998
6.147
-1.102
-15.21%
1 janv. 1999
5.244
-0.903
-14.68%
1 janv. 2000
5.58
+0.335
6.39%
1 janv. 2001
4.933
-0.647
-11.6%
1 janv. 2002
4.6
-0.332
-6.74%
1 janv. 2003
5.129
+0.528
11.48%
1 janv. 2004
6.298
+1.17
22.81%
1 janv. 2005
5.616
-0.682
-10.84%
1 janv. 2006
5.427
-0.189
-3.36%
1 janv. 2007
5.709
+0.281
5.18%
1 janv. 2008
7.595
+1.886
33.04%
1 janv. 2009
6.528
-1.066
-14.04%
1 janv. 2010
9.446
+2.918
44.7%
1 janv. 2011
8.113
-1.333
-14.11%
1 janv. 2012
7.862
-0.251
-3.09%
1 janv. 2013
8.841
+0.979
12.45%
1 janv. 2014
8.554
-0.288
-3.25%
1 janv. 2015
8.473
-0.081
-0.94%
1 janv. 2016
10.049
+1.576
18.6%
Classement des pays selon les statistiques actuelles par années


Commentaires: