29
/fr/
fr
AIzaSyAYiBZKx7MnpbEhh9jyipgxe19OcubqV5w
April 1, 2024
41800
Latin America & Caribbean
LCN
false
2
1
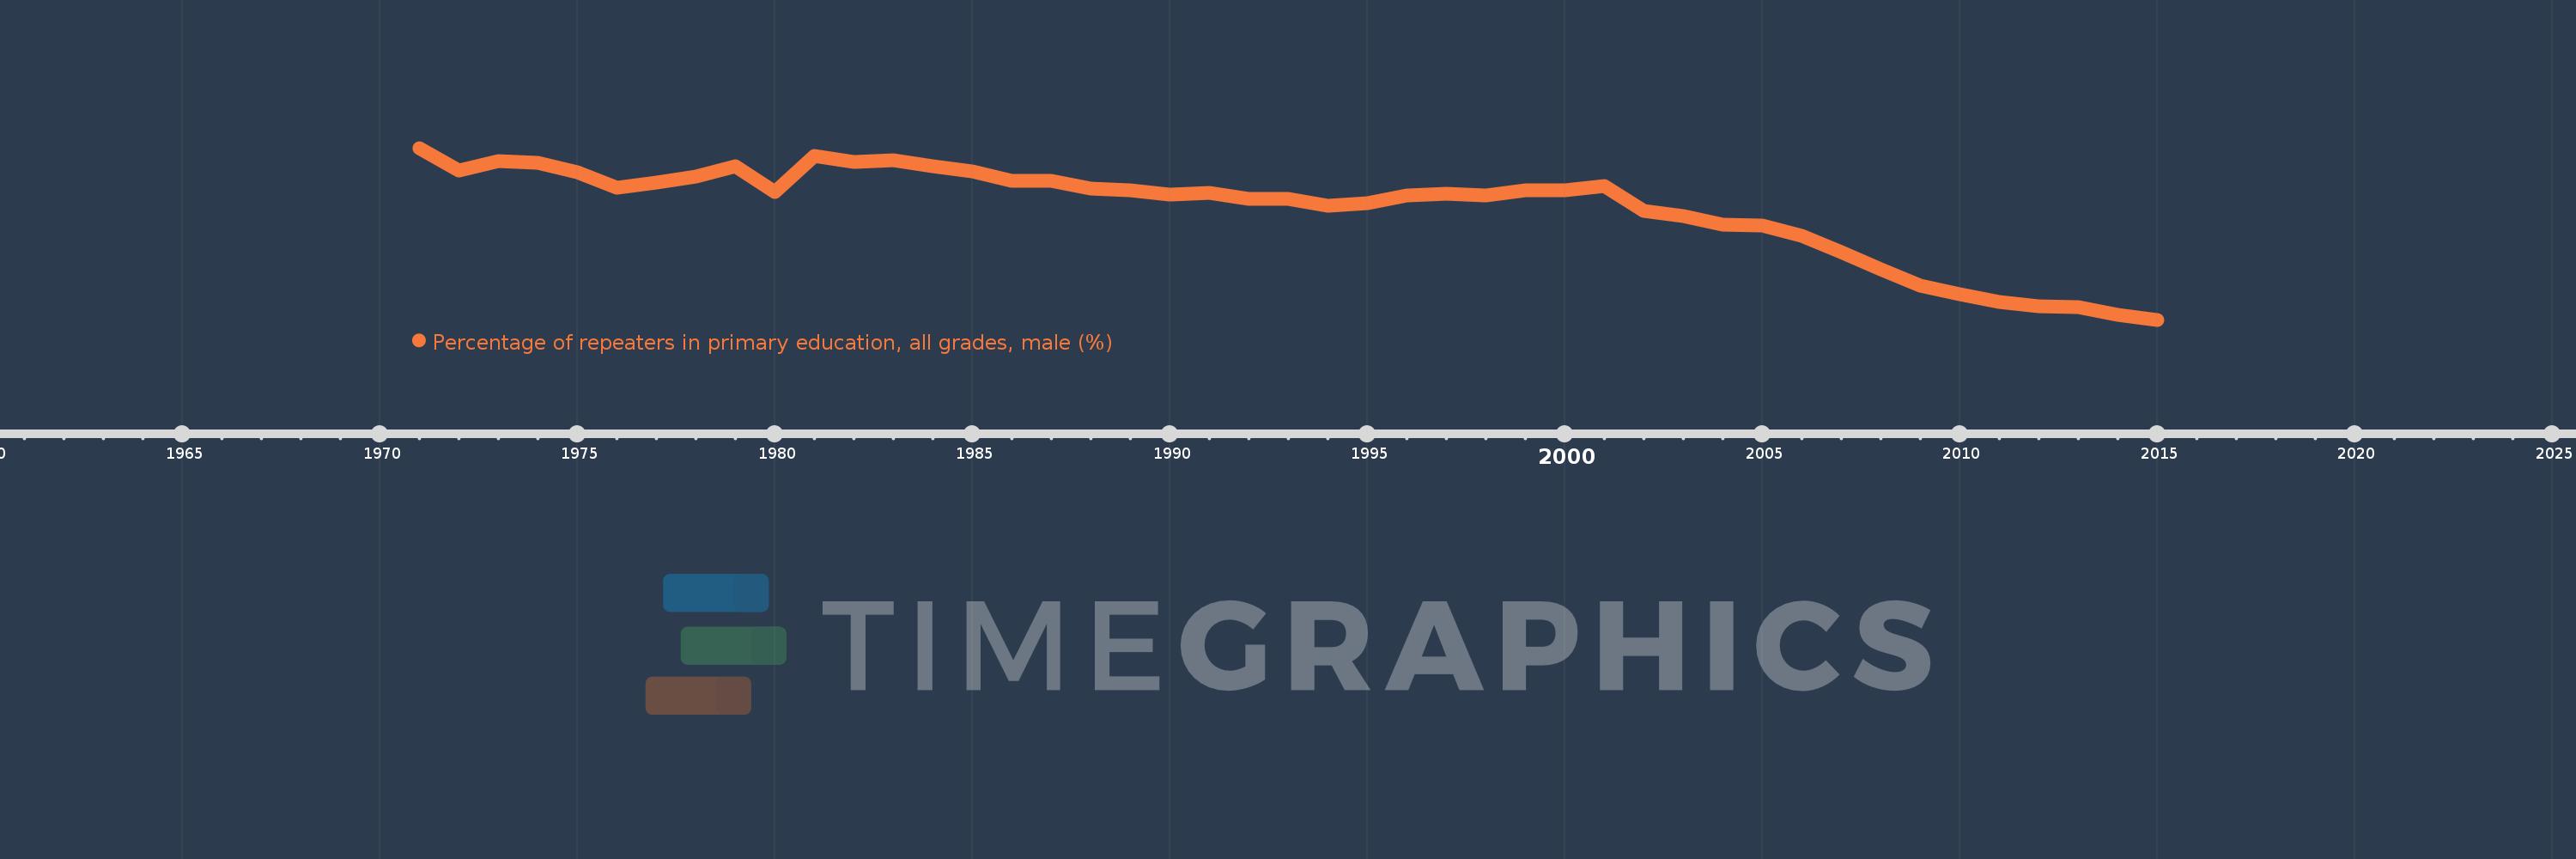
Percentage of repeaters in primary education, all grades, male (%)
2015,2014,2013,2012,2011,2010,2009,2008,2007,2006,2005,2004,2003,2002,2001,2000,1999,1998,1997,1996,1995,1994,1993,1992,1991,1990,1989,1988,1987,1986,1985,1984,1983,1982,1981,1980,1979,1978,1977,1976,1975,1974,1973,1972,1971
Cette statistique dans les autres pays:
AfghanistanAlbaniaAlgeriaAndorraAngolaAntigua and BarbudaArab WorldArgentinaArmeniaArubaAustriaAzerbaijanBahamas, TheBahrainBangladeshBelarusBelgiumBelizeBeninBermudaBhutanBoliviaBosnia and HerzegovinaBotswanaBrazilBritish Virgin IslandsBrunei DarussalamBulgariaBurkina FasoBurundiCabo VerdeCambodiaCameroonCanadaCaribbean small statesCayman IslandsCentral African RepublicCentral Europe and the BalticsChadChileChinaColombiaComorosCongo, Dem. Rep.Congo, Rep.Costa RicaCote d'IvoireCroatiaCubaCyprusCzech RepublicDenmarkDjiboutiDominicaDominican RepublicEarly-demographic dividendEast Asia & PacificEast Asia & Pacific (excluding high income)East Asia & Pacific (IDA & IBRD countries)EcuadorEgypt, Arab Rep.El SalvadorEquatorial GuineaEritreaEstoniaEthiopiaEuro areaEurope & Central AsiaEurope & Central Asia (excluding high income)Europe & Central Asia (IDA & IBRD countries)European UnionFijiFinlandFragile and conflict affected situationsFranceGabonGambia, TheGeorgiaGermanyGhanaGreeceGrenadaGuatemalaGuineaGuinea-BissauGuyanaHaitiHeavily indebted poor countries (HIPC)High incomeHondurasHong Kong SAR, ChinaHungaryIBRD onlyIcelandIDA & IBRD totalIDA blendIDA onlyIDA totalIndiaIndonesiaIran, Islamic Rep.IraqIrelandIsraelItalyJamaicaJapanJordanKazakhstanKenyaKiribatiKorea, Rep.KuwaitKyrgyz RepublicLao PDRLate-demographic dividendLatin America & Caribbean Latin America & Caribbean (excluding high income)Latin America & the Caribbean (IDA & IBRD countries)LatviaLeast developed countries: UN classificationLebanonLesothoLiberiaLibyaLiechtensteinLithuaniaLow & middle incomeLow incomeLower middle incomeLuxembourgMacao SAR, ChinaMacedonia, FYRMadagascarMalawiMalaysiaMaldivesMaliMaltaMauritaniaMauritiusMexicoMiddle East & North AfricaMiddle East & North Africa (excluding high income)Middle East & North Africa (IDA & IBRD countries)Middle incomeMoldovaMonacoMongoliaMontenegroMoroccoMozambiqueMyanmarNamibiaNauruNepalNetherlandsNew ZealandNicaraguaNigerNorwayOECD membersOmanOther small statesPacific island small statesPakistanPalauPanamaPapua New GuineaParaguayPeruPhilippinesPolandPortugalPost-demographic dividendPre-demographic dividendQatarRomaniaRussian FederationRwandaSamoaSan MarinoSao Tome and PrincipeSaudi ArabiaSenegalSerbiaSeychellesSierra LeoneSingaporeSint Maarten (Dutch part)Slovak RepublicSloveniaSmall statesSolomon IslandsSomaliaSouth AfricaSouth AsiaSouth Asia (IDA & IBRD)South SudanSpainSri LankaSt. Kitts and NevisSt. LuciaSt. Vincent and the GrenadinesSub-Saharan Africa Sub-Saharan Africa (excluding high income)Sub-Saharan Africa (IDA & IBRD countries)SudanSurinameSwazilandSwedenSwitzerlandSyrian Arab RepublicTajikistanTanzaniaThailandTimor-LesteTogoTongaTrinidad and TobagoTunisiaTurkeyTurks and Caicos IslandsTuvaluUgandaUkraineUnited Arab EmiratesUnited KingdomUpper middle incomeUruguayUzbekistanVanuatuVenezuela, RBVietnamWest Bank and GazaWorldYemen, Rep.ZambiaZimbabwe La ligne de temps
Cette échelle de temps montre un graphique de 1971 année à 2015 année Latin America & Caribbean . Les données jusqu'à 1970 année ne sont pas présentés. Quantité d'observations actuelles selon dates: 45.
Source (désignation):
Les indicateurs du développement mondiale
Source (organisation):
UNESCO Institute for Statistics
Catégories:
Education, Gender
Dernière mise à jour
23 avr. 2017
Les indicateurs de changement de valeurs selon les années
Maximum:
16.23
1 janv. 1971
Pour la date d''observation
Valeur
Changement absolu
Le changement par rapport à la valeur précédente
1 janv. 1971
16.23
+16.23
0.0%
1 janv. 1972
14.298
-1.932
-11.9%
1 janv. 1973
15.145
+0.847
5.92%
1 janv. 1974
14.937
-0.207
-1.37%
1 janv. 1975
14.196
-0.741
-4.96%
1 janv. 1976
12.87
-1.326
-9.34%
1 janv. 1977
13.275
+0.404
3.14%
1 janv. 1978
13.81
+0.535
4.03%
1 janv. 1979
14.679
+0.869
6.29%
1 janv. 1980
12.511
-2.167
-14.77%
1 janv. 1981
15.518
+3.006
24.03%
1 janv. 1982
15.055
-0.463
-2.98%
1 janv. 1983
15.173
+0.118
0.78%
1 janv. 1984
14.67
-0.503
-3.31%
1 janv. 1985
14.231
-0.439
-2.99%
1 janv. 1986
13.444
-0.787
-5.53%
1 janv. 1987
13.399
-0.045
-0.34%
1 janv. 1988
12.741
-0.658
-4.91%
1 janv. 1989
12.617
-0.125
-0.98%
1 janv. 1990
12.276
-0.341
-2.7%
1 janv. 1991
12.41
+0.134
1.1%
1 janv. 1992
11.906
-0.504
-4.06%
1 janv. 1993
11.931
+0.025
0.21%
1 janv. 1994
11.339
-0.592
-4.96%
1 janv. 1995
11.506
+0.166
1.47%
1 janv. 1996
12.194
+0.688
5.98%
1 janv. 1997
12.339
+0.145
1.19%
1 janv. 1998
12.165
-0.174
-1.41%
1 janv. 1999
12.636
+0.471
3.87%
1 janv. 2000
12.606
-0.029
-0.23%
1 janv. 2001
12.97
+0.363
2.88%
1 janv. 2002
10.91
-2.06
-15.88%
1 janv. 2003
10.426
-0.484
-4.44%
1 janv. 2004
9.689
-0.737
-7.07%
1 janv. 2005
9.618
-0.072
-0.74%
1 janv. 2006
8.781
-0.836
-8.69%
1 janv. 2007
7.381
-1.4
-15.94%
1 janv. 2008
5.9
-1.482
-20.07%
1 janv. 2009
4.505
-1.394
-23.63%
1 janv. 2010
3.823
-0.682
-15.15%
1 janv. 2011
3.129
-0.694
-18.15%
1 janv. 2012
2.785
-0.344
-10.99%
1 janv. 2013
2.673
-0.112
-4.02%
1 janv. 2014
2.07
-0.603
-22.56%
1 janv. 2015
1.62
-0.45
-21.73%
Classement des pays selon les statistiques actuelles par années


Commentaires: