29
/fr/
fr
AIzaSyAYiBZKx7MnpbEhh9jyipgxe19OcubqV5w
April 1, 2024
41748
Latin America & Caribbean
LCN
false
2
1
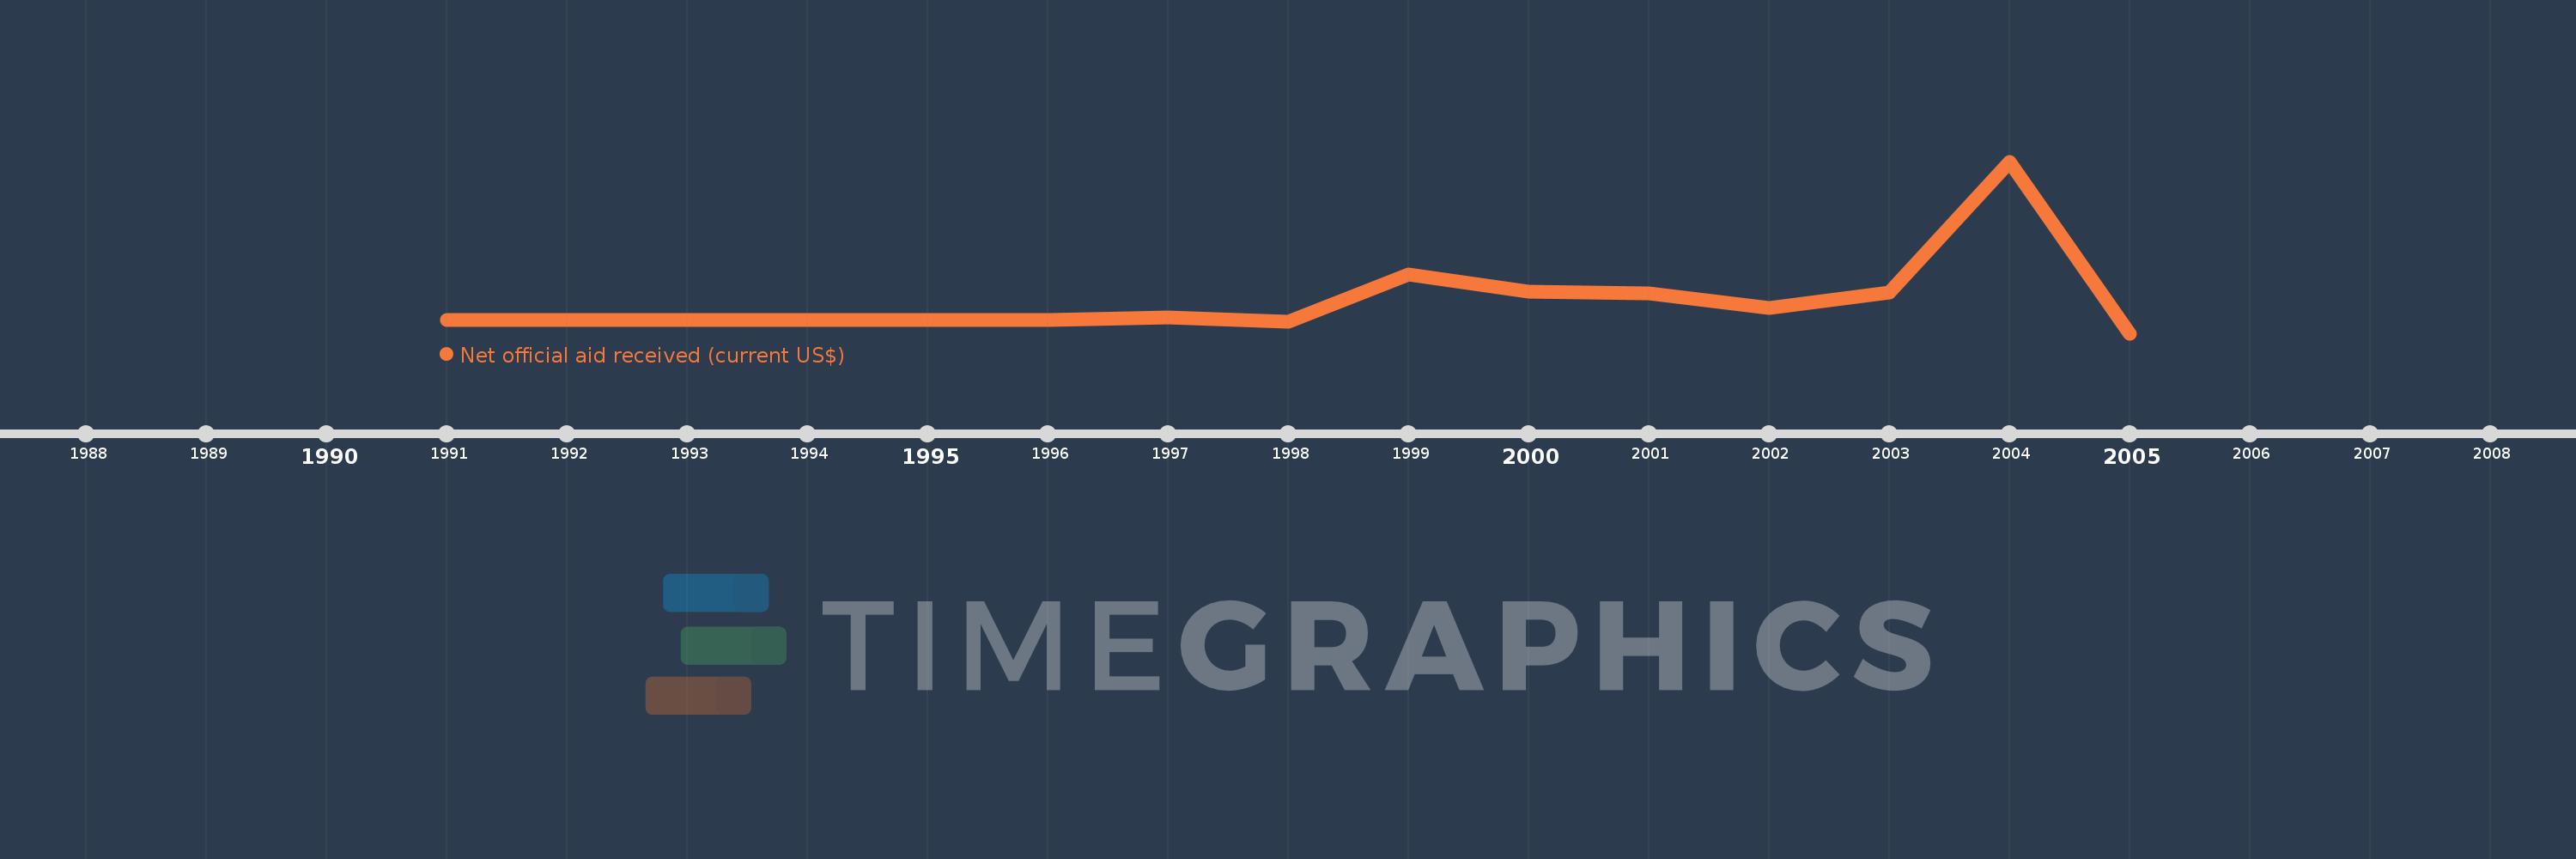
Net official aid received (current US$)
2005,2004,2003,2002,2001,2000,1999,1998,1997,1996,1995,1994,1993,1992,1991
Cette statistique dans les autres pays:
La ligne de temps
Cette échelle de temps montre un graphique de 1991 année à 2005 année Latin America & Caribbean . Les données jusqu'à 1990 année ne sont pas présentés. Quantité d'observations actuelles selon dates: 15.
Source (désignation):
Les indicateurs du développement mondiale
Source (organisation):
Development Assistance Committee of the Organisation for Economic Co-operation and Development, Geographical Distribution of Financial Flows to Developing Countries, Development Co-operation Report, and International Development Statistics database. Data are available online at: www.oecd.org/dac/stats/idsonline.
Catégories:
Aid Effectiveness
Dernière mise à jour
23 avr. 2017
Les indicateurs de changement de valeurs selon les années
Minimum:
-6.51 mln.
1 janv. 2005
Maximum:
78.57 mln.
1 janv. 2004
Pour la date d''observation
Valeur
Changement absolu
Le changement par rapport à la valeur précédente
1 janv. 1997
1.45 mln.
+1.45 mln.
%
1 janv. 1998
-570.0 milles
-2.02 mln.
-139.31%
1 janv. 1999
22.53 mln.
+23.1 mln.
-4.05 milles%
1 janv. 2000
14.33 mln.
-8.2 mln.
-36.4%
1 janv. 2001
13.13 mln.
-1.2 mln.
-8.37%
1 janv. 2002
5.97 mln.
-7.16 mln.
-54.53%
1 janv. 2003
13.71 mln.
+7.74 mln.
129.65%
1 janv. 2004
78.57 mln.
+64.86 mln.
473.09%
1 janv. 2005
-6.51 mln.
-85.08 mln.
-108.29%
Classement des pays selon les statistiques actuelles par années


Commentaires: