29
/fr/
fr
AIzaSyAYiBZKx7MnpbEhh9jyipgxe19OcubqV5w
April 1, 2024
41562
Latin America & Caribbean
LCN
false
2
1
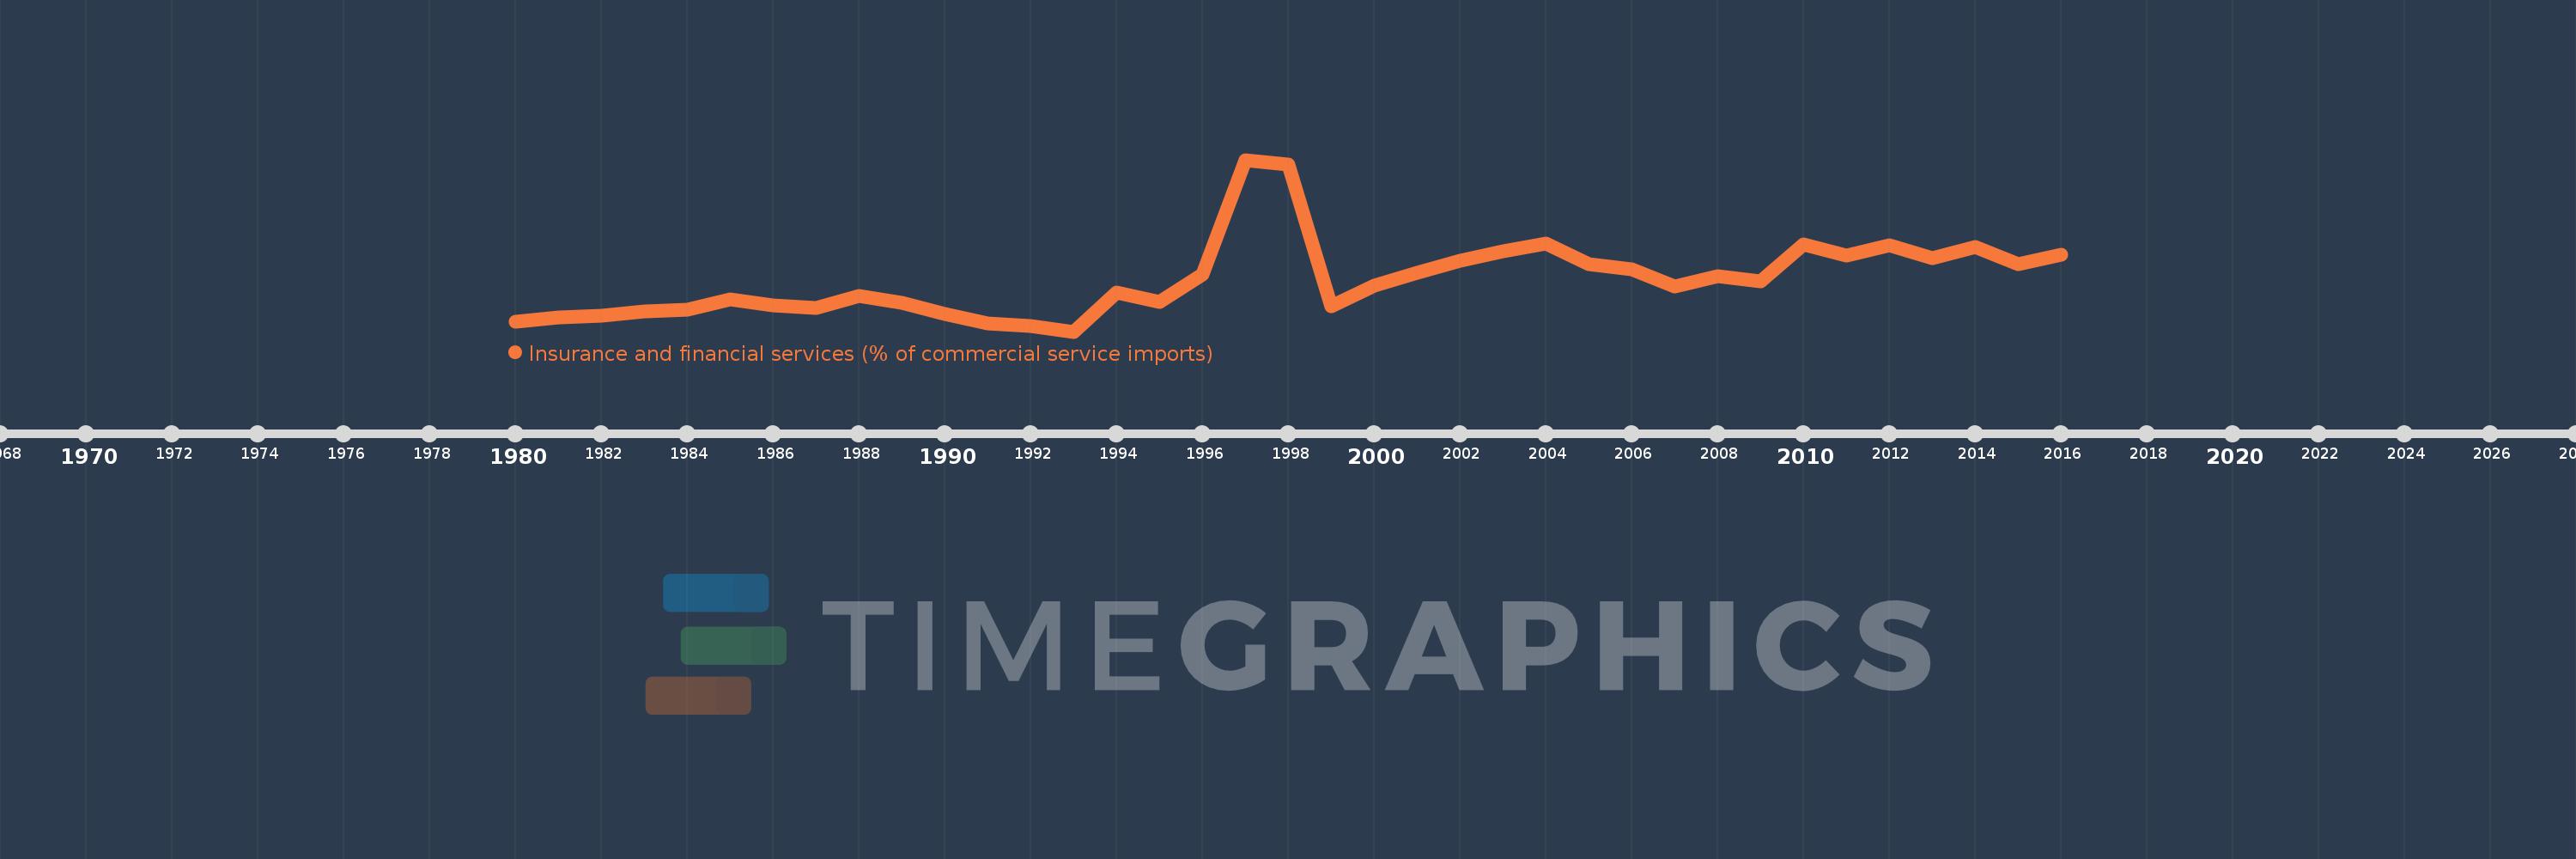
Insurance and financial services (% of commercial service imports)
2016,2015,2014,2013,2012,2011,2010,2009,2008,2007,2006,2005,2004,2003,2002,2001,2000,1999,1998,1997,1996,1995,1994,1993,1992,1991,1990,1989,1988,1987,1986,1985,1984,1983,1982,1981,1980
Cette statistique dans les autres pays:
AfghanistanAlbaniaAlgeriaAngolaAntigua and BarbudaArab WorldArgentinaArmeniaArubaAustraliaAustriaAzerbaijanBahamas, TheBahrainBangladeshBarbadosBelarusBelgiumBelizeBeninBermudaBhutanBoliviaBosnia and HerzegovinaBotswanaBrazilBrunei DarussalamBulgariaBurkina FasoBurundiCabo VerdeCambodiaCameroonCanadaCaribbean small statesCentral African RepublicCentral Europe and the BalticsChadChileChinaColombiaComorosCongo, Dem. Rep.Congo, Rep.Costa RicaCote d'IvoireCroatiaCuracaoCyprusCzech RepublicDenmarkDjiboutiDominicaDominican RepublicEarly-demographic dividendEast Asia & PacificEast Asia & Pacific (excluding high income)East Asia & Pacific (IDA & IBRD countries)EcuadorEgypt, Arab Rep.El SalvadorEquatorial GuineaEritreaEstoniaEthiopiaEuro areaEurope & Central AsiaEurope & Central Asia (excluding high income)Europe & Central Asia (IDA & IBRD countries)European UnionFaroe IslandsFijiFinlandFragile and conflict affected situationsFranceFrench PolynesiaGabonGambia, TheGeorgiaGermanyGhanaGreeceGrenadaGuatemalaGuineaGuinea-BissauGuyanaHaitiHeavily indebted poor countries (HIPC)High incomeHondurasHong Kong SAR, ChinaHungaryIBRD onlyIcelandIDA & IBRD totalIDA onlyIDA totalIndiaIndonesiaIran, Islamic Rep.IraqIrelandIsraelItalyJamaicaJapanJordanKazakhstanKenyaKiribatiKorea, Rep.KosovoKuwaitKyrgyz RepublicLao PDRLate-demographic dividendLatin America & Caribbean Latin America & Caribbean (excluding high income)Latin America & the Caribbean (IDA & IBRD countries)LatviaLeast developed countries: UN classificationLebanonLesothoLiberiaLibyaLithuaniaLow & middle incomeLow incomeLower middle incomeLuxembourgMacao SAR, ChinaMacedonia, FYRMadagascarMalawiMalaysiaMaldivesMaliMaltaMarshall IslandsMauritaniaMauritiusMexicoMicronesia, Fed. Sts.Middle East & North AfricaMiddle East & North Africa (excluding high income)Middle East & North Africa (IDA & IBRD countries)Middle incomeMoldovaMongoliaMontenegroMoroccoMozambiqueMyanmarNamibiaNepalNetherlandsNew CaledoniaNew ZealandNicaraguaNigerNigeriaNorth AmericaNorwayOECD membersOmanOther small statesPacific island small statesPakistanPalauPanamaPapua New GuineaParaguayPeruPhilippinesPolandPortugalPost-demographic dividendPre-demographic dividendQatarRomaniaRussian FederationRwandaSamoaSao Tome and PrincipeSaudi ArabiaSenegalSerbiaSeychellesSierra LeoneSingaporeSint Maarten (Dutch part)Slovak RepublicSloveniaSmall statesSolomon IslandsSouth AfricaSouth AsiaSouth Asia (IDA & IBRD)South SudanSpainSri LankaSt. Kitts and NevisSt. LuciaSt. Vincent and the GrenadinesSub-Saharan Africa Sub-Saharan Africa (excluding high income)Sub-Saharan Africa (IDA & IBRD countries)SudanSurinameSwazilandSwedenSwitzerlandSyrian Arab RepublicTajikistanTanzaniaThailandTimor-LesteTogoTongaTrinidad and TobagoTunisiaTurkeyTuvaluUgandaUkraineUnited KingdomUnited StatesUpper middle incomeUruguayVanuatuVenezuela, RBWest Bank and GazaWorldYemen, Rep.ZambiaZimbabwe La ligne de temps
Cette échelle de temps montre un graphique de 1980 année à 2016 année Latin America & Caribbean . Les données jusqu'à 1979 année ne sont pas présentés. Quantité d'observations actuelles selon dates: 37.
Source (désignation):
Les indicateurs du développement mondiale
Source (organisation):
International Monetary Fund, Balance of Payments Statistics Yearbook and data files.
Catégories:
Private Sector, Trade
Dernière mise à jour
23 avr. 2017
Les indicateurs de changement de valeurs selon les années
Minimum:
5.319
1 janv. 1993
Maximum:
18.206
1 janv. 1997
Pour la date d''observation
Valeur
Changement absolu
Le changement par rapport à la valeur précédente
1 janv. 1980
6.039
+6.039
0.0%
1 janv. 1981
6.41
+0.372
6.15%
1 janv. 1982
6.493
+0.083
1.29%
1 janv. 1983
6.823
+0.33
5.09%
1 janv. 1984
6.993
+0.169
2.48%
1 janv. 1985
7.713
+0.72
10.29%
1 janv. 1986
7.271
-0.441
-5.72%
1 janv. 1987
7.069
-0.202
-2.78%
1 janv. 1988
8.023
+0.954
13.5%
1 janv. 1989
7.477
-0.546
-6.81%
1 janv. 1990
6.626
-0.851
-11.38%
1 janv. 1991
5.921
-0.705
-10.64%
1 janv. 1992
5.732
-0.189
-3.19%
1 janv. 1993
5.319
-0.413
-7.2%
1 janv. 1994
8.227
+2.908
54.66%
1 janv. 1995
7.572
-0.655
-7.96%
1 janv. 1996
9.575
+2.003
26.46%
1 janv. 1997
18.206
+8.63
90.13%
1 janv. 1998
17.832
-0.373
-2.05%
1 janv. 1999
7.197
-10.636
-59.64%
1 janv. 2000
8.761
+1.565
21.74%
1 janv. 2001
9.751
+0.99
11.3%
1 janv. 2002
10.623
+0.873
8.95%
1 janv. 2003
11.364
+0.74
6.97%
1 janv. 2004
11.907
+0.543
4.78%
1 janv. 2005
10.391
-1.515
-12.73%
1 janv. 2006
10.009
-0.382
-3.68%
1 janv. 2007
8.727
-1.282
-12.81%
1 janv. 2008
9.471
+0.744
8.52%
1 janv. 2009
9.076
-0.395
-4.17%
1 janv. 2010
11.86
+2.784
30.67%
1 janv. 2011
11.021
-0.839
-7.07%
1 janv. 2012
11.822
+0.801
7.27%
1 janv. 2013
10.798
-1.025
-8.67%
1 janv. 2014
11.662
+0.865
8.01%
1 janv. 2015
10.356
-1.306
-11.2%
1 janv. 2016
11.104
+0.748
7.22%
Classement des pays selon les statistiques actuelles par années


Commentaires: