29
/fr/
fr
AIzaSyAYiBZKx7MnpbEhh9jyipgxe19OcubqV5w
April 1, 2024
41500
Latin America & Caribbean
LCN
false
2
1
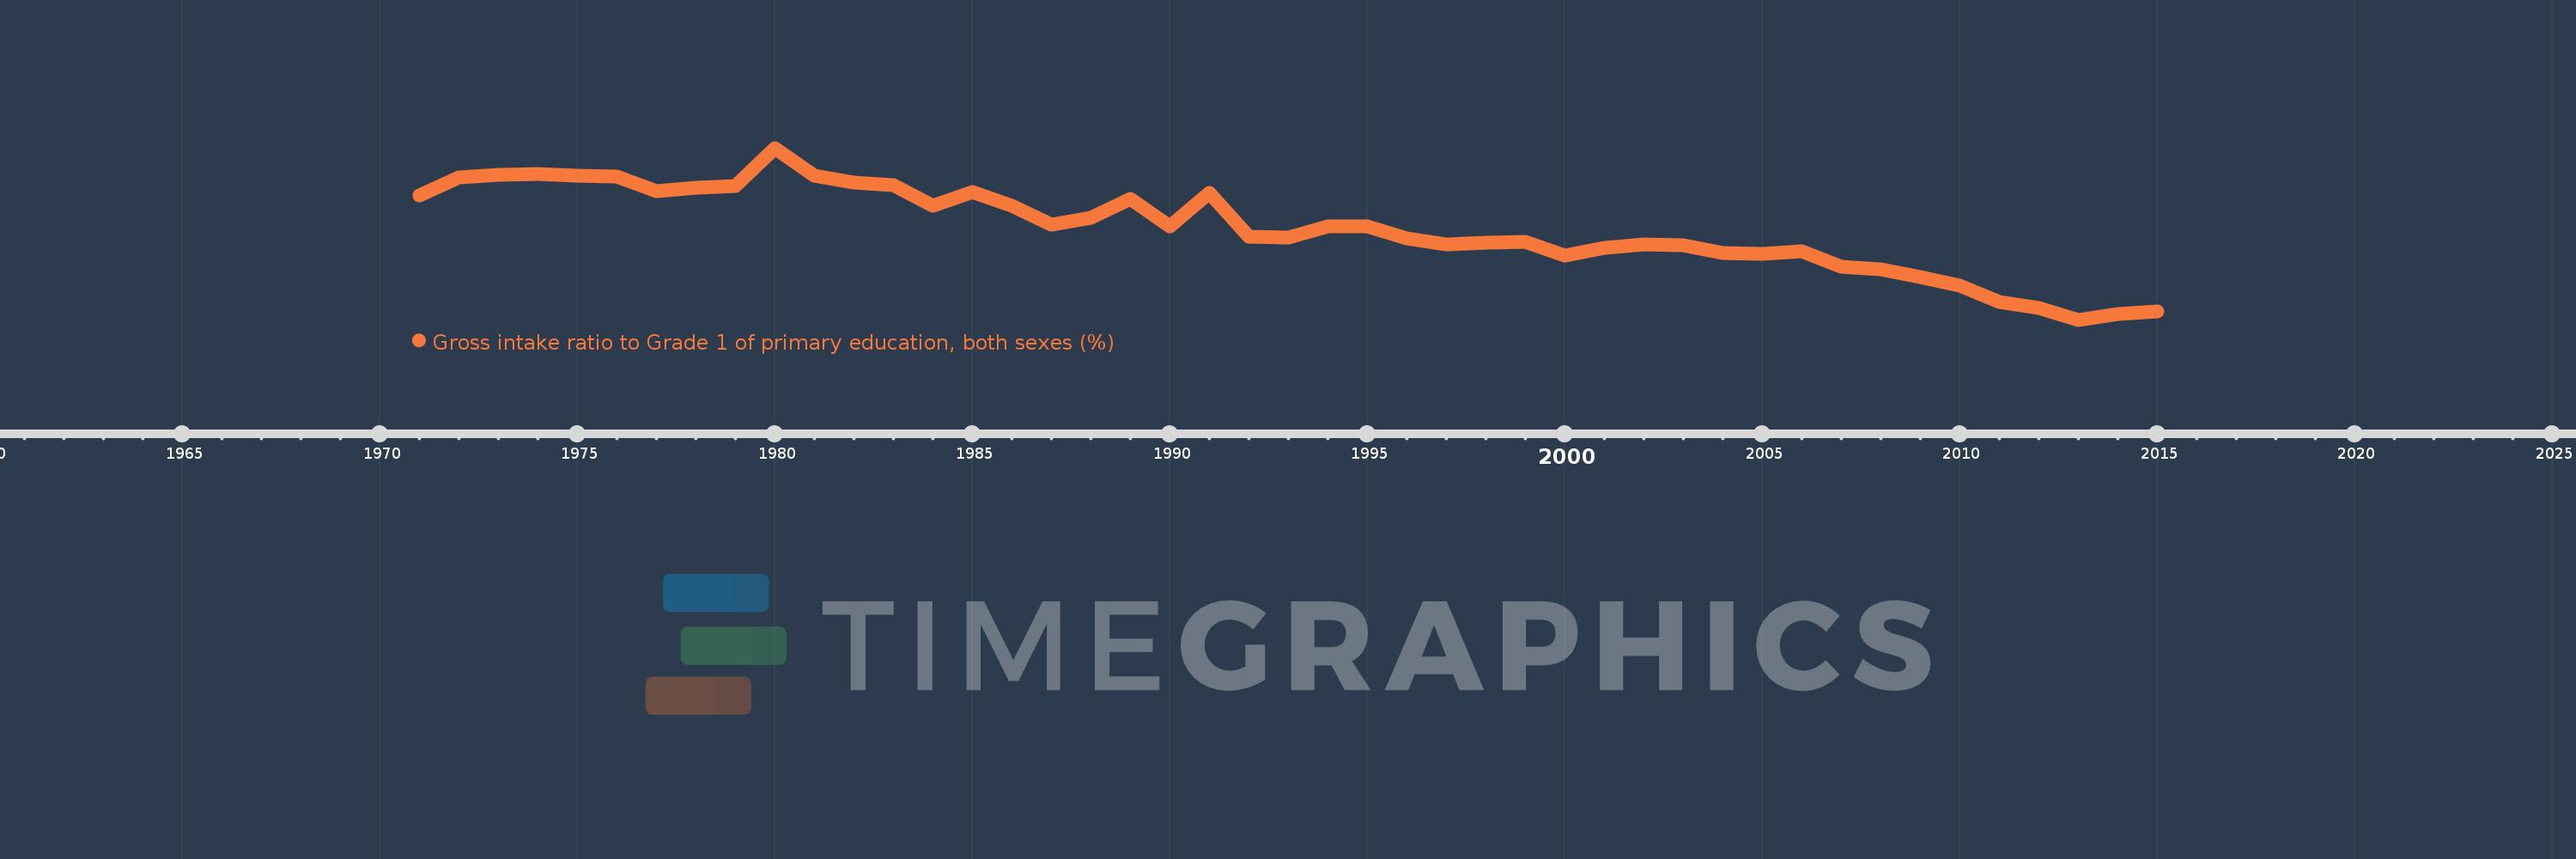
Gross intake ratio to Grade 1 of primary education, both sexes (%)
2015,2014,2013,2012,2011,2010,2009,2008,2007,2006,2005,2004,2003,2002,2001,2000,1999,1998,1997,1996,1995,1994,1993,1992,1991,1990,1989,1988,1987,1986,1985,1984,1983,1982,1981,1980,1979,1978,1977,1976,1975,1974,1973,1972,1971
Cette statistique dans les autres pays:
AfghanistanAlbaniaAlgeriaAngolaAntigua and BarbudaArab WorldArgentinaArmeniaArubaAustriaAzerbaijanBahamas, TheBahrainBangladeshBarbadosBelarusBelgiumBelizeBeninBermudaBhutanBoliviaBosnia and HerzegovinaBotswanaBrazilBritish Virgin IslandsBrunei DarussalamBulgariaBurkina FasoBurundiCabo VerdeCambodiaCameroonCanadaCaribbean small statesCentral African RepublicCentral Europe and the BalticsChadChileChinaColombiaComorosCongo, Dem. Rep.Congo, Rep.Costa RicaCote d'IvoireCroatiaCubaCyprusCzech RepublicDenmarkDjiboutiDominicaDominican RepublicEarly-demographic dividendEast Asia & PacificEast Asia & Pacific (excluding high income)East Asia & Pacific (IDA & IBRD countries)EcuadorEgypt, Arab Rep.El SalvadorEquatorial GuineaEritreaEstoniaEthiopiaEuro areaEurope & Central AsiaEurope & Central Asia (excluding high income)Europe & Central Asia (IDA & IBRD countries)European UnionFijiFinlandFragile and conflict affected situationsFranceGabonGambia, TheGeorgiaGermanyGhanaGreeceGrenadaGuatemalaGuineaGuinea-BissauGuyanaHaitiHeavily indebted poor countries (HIPC)High incomeHondurasHong Kong SAR, ChinaHungaryIBRD onlyIcelandIDA & IBRD totalIDA blendIDA onlyIDA totalIndiaIndonesiaIran, Islamic Rep.IraqIrelandIsraelItalyJamaicaJapanJordanKazakhstanKenyaKiribatiKorea, Dem. People’s Rep.Korea, Rep.KuwaitKyrgyz RepublicLao PDRLate-demographic dividendLatin America & Caribbean Latin America & Caribbean (excluding high income)Latin America & the Caribbean (IDA & IBRD countries)LatviaLeast developed countries: UN classificationLebanonLesothoLiberiaLibyaLiechtensteinLithuaniaLow & middle incomeLow incomeLower middle incomeLuxembourgMacao SAR, ChinaMacedonia, FYRMadagascarMalawiMalaysiaMaldivesMaliMaltaMarshall IslandsMauritaniaMauritiusMexicoMicronesia, Fed. Sts.Middle East & North AfricaMiddle East & North Africa (excluding high income)Middle East & North Africa (IDA & IBRD countries)Middle incomeMoldovaMongoliaMontenegroMoroccoMozambiqueMyanmarNamibiaNauruNepalNetherlandsNew ZealandNicaraguaNigerNigeriaNorth AmericaNorwayOECD membersOmanOther small statesPacific island small statesPakistanPalauPanamaPapua New GuineaParaguayPeruPhilippinesPolandPortugalPost-demographic dividendPre-demographic dividendPuerto RicoQatarRomaniaRussian FederationRwandaSamoaSan MarinoSao Tome and PrincipeSaudi ArabiaSenegalSerbiaSeychellesSierra LeoneSlovak RepublicSloveniaSmall statesSolomon IslandsSouth AfricaSouth AsiaSouth Asia (IDA & IBRD)South SudanSpainSri LankaSt. Kitts and NevisSt. LuciaSt. Vincent and the GrenadinesSub-Saharan Africa Sub-Saharan Africa (excluding high income)Sub-Saharan Africa (IDA & IBRD countries)SudanSurinameSwazilandSwedenSwitzerlandSyrian Arab RepublicTajikistanTanzaniaThailandTimor-LesteTogoTongaTrinidad and TobagoTunisiaTurkeyTuvaluUgandaUkraineUnited Arab EmiratesUnited StatesUpper middle incomeUruguayUzbekistanVanuatuVenezuela, RBVietnamWest Bank and GazaWorldYemen, Rep.ZambiaZimbabwe La ligne de temps
Cette échelle de temps montre un graphique de 1971 année à 2015 année Latin America & Caribbean . Les données jusqu'à 1970 année ne sont pas présentés. Quantité d'observations actuelles selon dates: 45.
Source (désignation):
Les indicateurs du développement mondiale
Source (organisation):
UNESCO Institute for Statistics
Catégories:
Education
Dernière mise à jour
23 avr. 2017
Les indicateurs de changement de valeurs selon les années
Minimum:
96.175
1 janv. 2013
Maximum:
147.366
1 janv. 1980
Pour la date d''observation
Valeur
Changement absolu
Le changement par rapport à la valeur précédente
1 janv. 1971
133.327
+133.327
0.0%
1 janv. 1972
138.69
+5.363
4.02%
1 janv. 1973
139.38
+0.69
0.5%
1 janv. 1974
139.579
+0.199
0.14%
1 janv. 1975
139.145
-0.434
-0.31%
1 janv. 1976
138.843
-0.302
-0.22%
1 janv. 1977
134.549
-4.294
-3.09%
1 janv. 1978
135.428
+0.879
0.65%
1 janv. 1979
135.956
+0.529
0.39%
1 janv. 1980
147.366
+11.409
8.39%
1 janv. 1981
139.008
-8.357
-5.67%
1 janv. 1982
137.117
-1.891
-1.36%
1 janv. 1983
136.27
-0.847
-0.62%
1 janv. 1984
130.246
-6.024
-4.42%
1 janv. 1985
134.266
+4.02
3.09%
1 janv. 1986
130.226
-4.04
-3.01%
1 janv. 1987
124.433
-5.793
-4.45%
1 janv. 1988
126.486
+2.053
1.65%
1 janv. 1989
132.247
+5.762
4.56%
1 janv. 1990
124.079
-8.168
-6.18%
1 janv. 1991
134.026
+9.947
8.02%
1 janv. 1992
120.901
-13.125
-9.79%
1 janv. 1993
120.581
-0.32
-0.26%
1 janv. 1994
123.928
+3.347
2.78%
1 janv. 1995
123.916
-0.012
-0.01%
1 janv. 1996
120.516
-3.4
-2.74%
1 janv. 1997
118.731
-1.784
-1.48%
1 janv. 1998
119.202
+0.471
0.4%
1 janv. 1999
119.511
+0.309
0.26%
1 janv. 2000
115.245
-4.267
-3.57%
1 janv. 2001
117.552
+2.307
2.0%
1 janv. 2002
118.736
+1.184
1.01%
1 janv. 2003
118.271
-0.465
-0.39%
1 janv. 2004
116.03
-2.241
-1.89%
1 janv. 2005
115.815
-0.215
-0.19%
1 janv. 2006
116.521
+0.706
0.61%
1 janv. 2007
111.863
-4.657
-4.0%
1 janv. 2008
111.266
-0.597
-0.53%
1 janv. 2009
108.926
-2.34
-2.1%
1 janv. 2010
106.411
-2.516
-2.31%
1 janv. 2011
101.383
-5.027
-4.72%
1 janv. 2012
99.697
-1.686
-1.66%
1 janv. 2013
96.175
-3.522
-3.53%
1 janv. 2014
97.77
+1.595
1.66%
1 janv. 2015
98.729
+0.96
0.98%
Classement des pays selon les statistiques actuelles par années


Commentaires: