29
/fr/
fr
AIzaSyAYiBZKx7MnpbEhh9jyipgxe19OcubqV5w
April 1, 2024
40181
IDA total
IDA
false
2
1
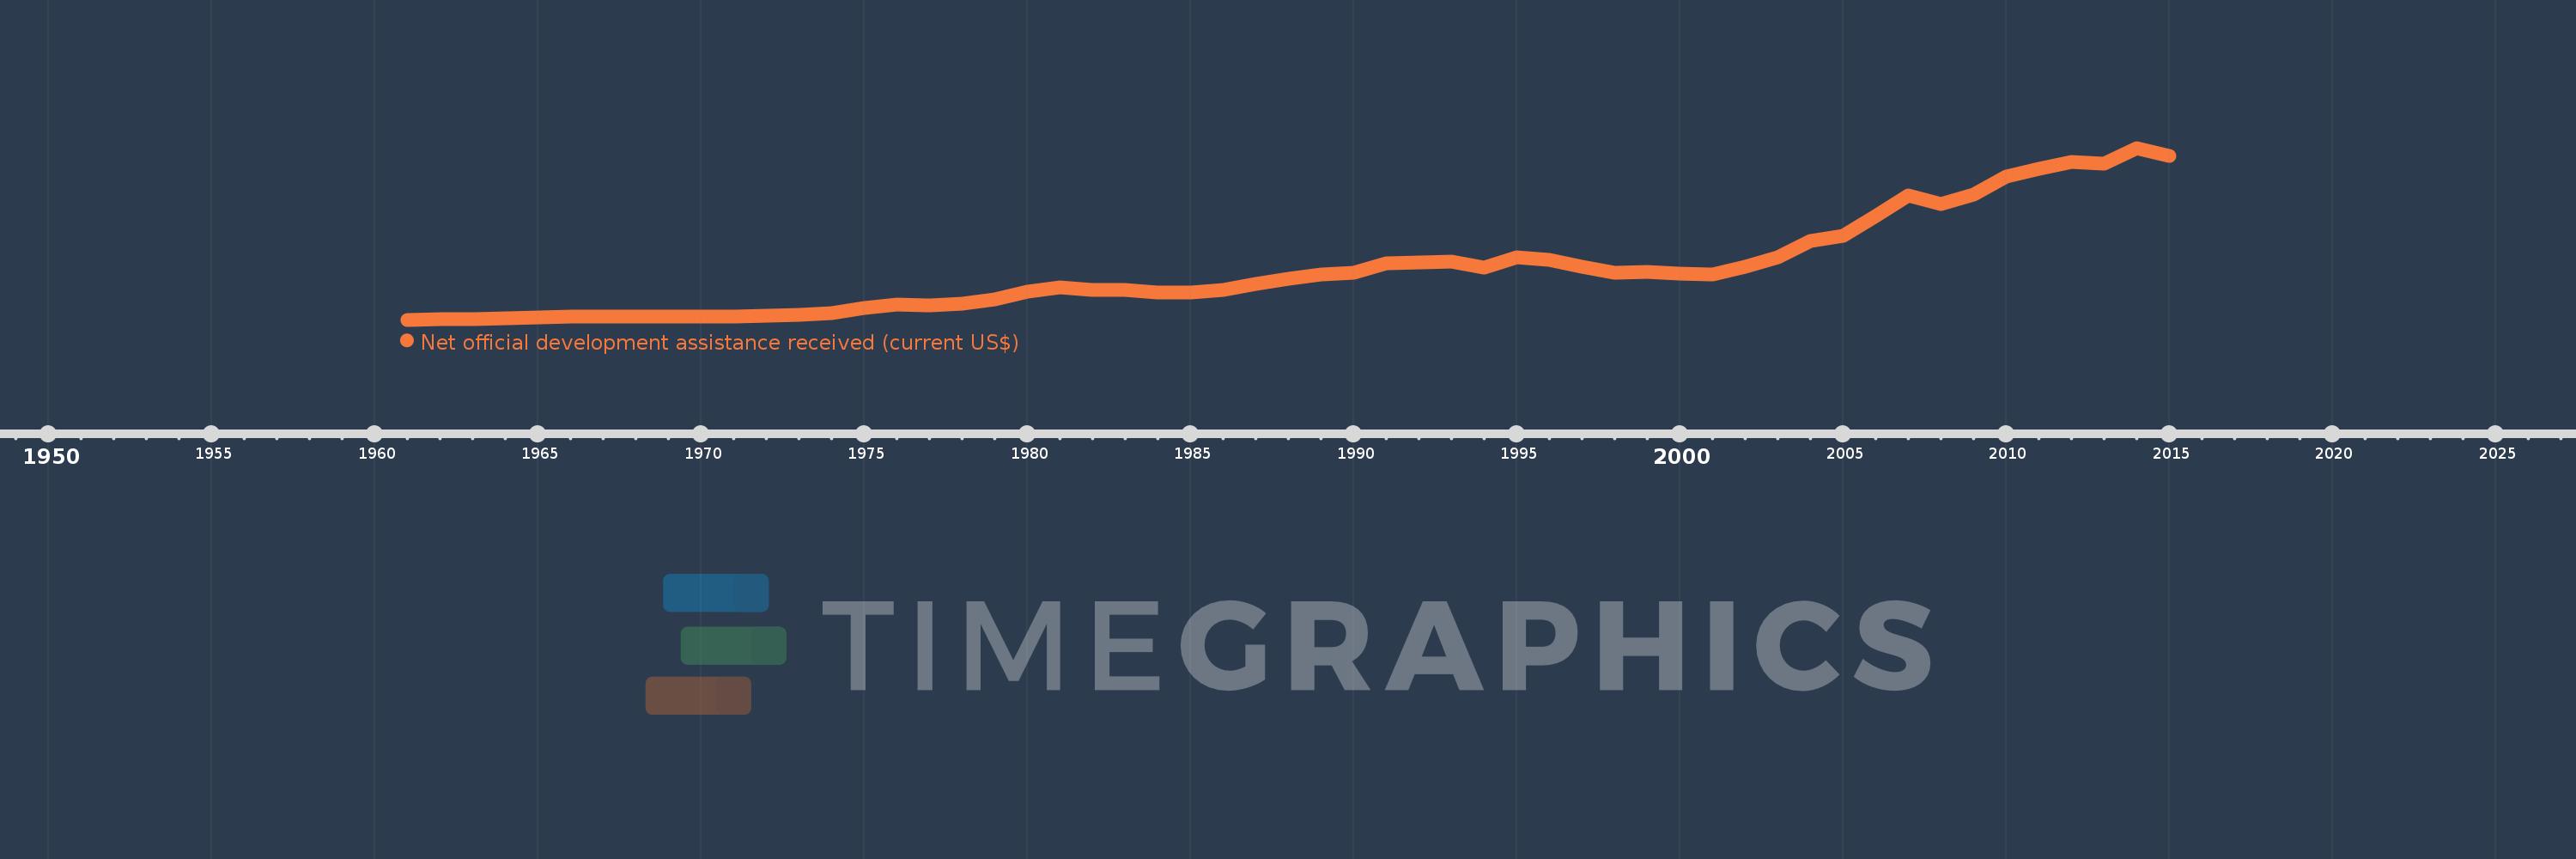
Net official development assistance received (current US$)
2015,2014,2013,2012,2011,2010,2009,2008,2007,2006,2005,2004,2003,2002,2001,2000,1999,1998,1997,1996,1995,1994,1993,1992,1991,1990,1989,1988,1987,1986,1985,1984,1983,1982,1981,1980,1979,1978,1977,1976,1975,1974,1973,1972,1971,1970,1969,1968,1967,1966,1965,1964,1963,1962,1961
Cette statistique dans les autres pays:
AfghanistanAlbaniaAlgeriaAngolaAntigua and BarbudaArab WorldArgentinaArmeniaArubaAzerbaijanBahamas, TheBahrainBangladeshBarbadosBelarusBelizeBeninBermudaBhutanBoliviaBosnia and HerzegovinaBotswanaBrazilBritish Virgin IslandsBrunei DarussalamBurkina FasoBurundiCabo VerdeCambodiaCameroonCaribbean small statesCayman IslandsCentral African RepublicCentral Europe and the BalticsChadChileChinaColombiaComorosCongo, Dem. Rep.Congo, Rep.Costa RicaCote d'IvoireCroatiaCubaCyprusDjiboutiDominicaDominican RepublicEast Asia & PacificEast Asia & Pacific (excluding high income)East Asia & Pacific (IDA & IBRD countries)EcuadorEgypt, Arab Rep.El SalvadorEquatorial GuineaEritreaEthiopiaEuro areaEurope & Central AsiaEurope & Central Asia (excluding high income)Europe & Central Asia (IDA & IBRD countries)European UnionFijiFragile and conflict affected situationsFrench PolynesiaGabonGambia, TheGeorgiaGhanaGibraltarGrenadaGuatemalaGuineaGuinea-BissauGuyanaHaitiHeavily indebted poor countries (HIPC)High incomeHondurasHong Kong SAR, ChinaIBRD onlyIDA & IBRD totalIDA blendIDA onlyIDA totalIndiaIndonesiaIran, Islamic Rep.IraqIsraelJamaicaJordanKazakhstanKenyaKiribatiKorea, Dem. People’s Rep.Korea, Rep.KosovoKuwaitKyrgyz RepublicLao PDRLatin America & Caribbean Latin America & Caribbean (excluding high income)Latin America & the Caribbean (IDA & IBRD countries)Least developed countries: UN classificationLebanonLesothoLiberiaLibyaLow & middle incomeLow incomeLower middle incomeMacao SAR, ChinaMacedonia, FYRMadagascarMalawiMalaysiaMaldivesMaliMaltaMarshall IslandsMauritaniaMauritiusMexicoMicronesia, Fed. Sts.Middle East & North AfricaMiddle East & North Africa (excluding high income)Middle East & North Africa (IDA & IBRD countries)Middle incomeMoldovaMongoliaMontenegroMoroccoMozambiqueMyanmarNamibiaNauruNepalNew CaledoniaNicaraguaNigerNigeriaNorth AmericaNorthern Mariana IslandsOECD membersOmanOther small statesPacific island small statesPakistanPalauPanamaPapua New GuineaParaguayPeruPhilippinesQatarRwandaSamoaSao Tome and PrincipeSaudi ArabiaSenegalSerbiaSeychellesSierra LeoneSingaporeSloveniaSmall statesSolomon IslandsSomaliaSouth AfricaSouth AsiaSouth Asia (IDA & IBRD)South SudanSri LankaSt. Kitts and NevisSt. LuciaSt. Vincent and the GrenadinesSub-Saharan Africa Sub-Saharan Africa (excluding high income)Sub-Saharan Africa (IDA & IBRD countries)SudanSurinameSwazilandSyrian Arab RepublicTajikistanTanzaniaThailandTimor-LesteTogoTongaTrinidad and TobagoTunisiaTurkeyTurkmenistanTurks and Caicos IslandsTuvaluUgandaUkraineUnited Arab EmiratesUpper middle incomeUruguayUzbekistanVanuatuVenezuela, RBVietnamWest Bank and GazaWorldYemen, Rep.ZambiaZimbabwe La ligne de temps
Cette échelle de temps montre un graphique de 1961 année à 2015 année IDA total. Les données jusqu'à 1960 année ne sont pas présentés. Quantité d'observations actuelles selon dates: 55.
Source (désignation):
Les indicateurs du développement mondiale
Source (organisation):
Development Assistance Committee of the Organisation for Economic Co-operation and Development, Geographical Distribution of Financial Flows to Developing Countries, Development Co-operation Report, and International Development Statistics database. Data are available online at: www.oecd.org/dac/stats/idsonline.
Catégories:
Aid Effectiveness, Economy & Growth, External Debt
Dernière mise à jour
23 avr. 2017
Les indicateurs de changement de valeurs selon les années
Minimum:
932.8 mln.
1 janv. 1961
Maximum:
74.055 mds
1 janv. 2014
Pour la date d''observation
Valeur
Changement absolu
Le changement par rapport à la valeur précédente
1 janv. 1961
932.8 mln.
+932.8 mln.
0.0%
1 janv. 1962
1.087 mds
+153.99 mln.
16.51%
1 janv. 1963
1.349 mds
+261.95 mln.
24.1%
1 janv. 1964
1.517 mds
+168.03 mln.
12.46%
1 janv. 1965
1.825 mds
+308.43 mln.
20.33%
1 janv. 1966
2.128 mds
+303.12 mln.
16.61%
1 janv. 1967
2.292 mds
+163.24 mln.
7.67%
1 janv. 1968
2.259 mds
-32.22 mln.
-1.41%
1 janv. 1969
2.271 mds
+11.37 mln.
0.5%
1 janv. 1970
2.201 mds
-69.46 mln.
-3.06%
1 janv. 1971
2.365 mds
+163.57 mln.
7.43%
1 janv. 1972
2.606 mds
+241.25 mln.
10.2%
1 janv. 1973
3.082 mds
+475.91 mln.
18.26%
1 janv. 1974
3.93 mds
+848.4 mln.
27.53%
1 janv. 1975
6.07 mds
+2.139 mds
54.43%
1 janv. 1976
7.511 mds
+1.442 mds
23.75%
1 janv. 1977
6.949 mds
-562.33 mln.
-7.49%
1 janv. 1978
7.777 mds
+828.55 mln.
11.92%
1 janv. 1979
9.735 mds
+1.958 mds
25.17%
1 janv. 1980
12.746 mds
+3.011 mds
30.93%
1 janv. 1981
14.745 mds
+1.998 mds
15.68%
1 janv. 1982
13.593 mds
-1.152 mds
-7.81%
1 janv. 1983
13.536 mds
-56.64 mln.
-0.42%
1 janv. 1984
12.367 mds
-1.17 mds
-8.64%
1 janv. 1985
12.631 mds
+264.35 mln.
2.14%
1 janv. 1986
13.527 mds
+896.04 mln.
7.09%
1 janv. 1987
16.333 mds
+2.806 mds
20.74%
1 janv. 1988
18.334 mds
+2.001 mds
12.25%
1 janv. 1989
20.137 mds
+1.803 mds
9.83%
1 janv. 1990
21.047 mds
+910.26 mln.
4.52%
1 janv. 1991
25.029 mds
+3.982 mds
18.92%
1 janv. 1992
25.308 mds
+279.36 mln.
1.12%
1 janv. 1993
25.745 mds
+436.38 mln.
1.72%
1 janv. 1994
23.189 mds
-2.555 mds
-9.93%
1 janv. 1995
27.35 mds
+4.161 mds
17.94%
1 janv. 1996
26.276 mds
-1.074 mds
-3.93%
1 janv. 1997
23.378 mds
-2.898 mds
-11.03%
1 janv. 1998
20.808 mds
-2.57 mds
-10.99%
1 janv. 1999
21.347 mds
+538.35 mln.
2.59%
1 janv. 2000
20.62 mds
-726.11 mln.
-3.4%
1 janv. 2001
20.278 mds
-342.66 mln.
-1.66%
1 janv. 2002
23.605 mds
+3.327 mds
16.41%
1 janv. 2003
27.572 mds
+3.967 mds
16.81%
1 janv. 2004
34.345 mds
+6.773 mds
24.57%
1 janv. 2005
36.821 mds
+2.477 mds
7.21%
1 janv. 2006
45.0 mds
+8.178 mds
22.21%
1 janv. 2007
53.859 mds
+8.86 mds
19.69%
1 janv. 2008
50.264 mds
-3.595 mds
-6.67%
1 janv. 2009
54.264 mds
+4.0 mds
7.96%
1 janv. 2010
61.976 mds
+7.712 mds
14.21%
1 janv. 2011
65.322 mds
+3.346 mds
5.4%
1 janv. 2012
68.205 mds
+2.883 mds
4.41%
1 janv. 2013
67.431 mds
-773.24 mln.
-1.13%
1 janv. 2014
74.055 mds
+6.623 mds
9.82%
1 janv. 2015
70.756 mds
-3.298 mds
-4.45%
Classement des pays selon les statistiques actuelles par années


Commentaires: