30
/fr/
AIzaSyAYiBZKx7MnpbEhh9jyipgxe19OcubqV5w
April 1, 2024
40046
IDA total
IDA
false
2
1
Labor force, total
2016,2015,2014,2013,2012,2011,2010,2009,2008,2007,2006,2005,2004,2003,2002,2001,2000,1999,1998,1997,1996,1995,1994,1993,1992,1991
Download
Bibliothèque de statistiques globales →IDA total →

Labor force, total

Cette statistique dans les autres pays:

AfghanistanAlbaniaAlgeriaAngolaArab WorldArgentinaArmeniaAustraliaAustriaAzerbaijanBahamas, TheBahrainBangladeshBarbadosBelarusBelgiumBelizeBeninBhutanBoliviaBosnia and HerzegovinaBotswanaBrazilBrunei DarussalamBulgariaBurkina FasoBurundiCabo VerdeCambodiaCameroonCanadaCaribbean small statesCentral African RepublicCentral Europe and the BalticsChadChannel IslandsChileChinaColombiaComorosCongo, Dem. Rep.Congo, Rep.Costa RicaCote d'IvoireCroatiaCubaCyprusCzech RepublicDenmarkDjiboutiDominican RepublicEarly-demographic dividendEast Asia & PacificEast Asia & Pacific (excluding high income)East Asia & Pacific (IDA & IBRD countries)EcuadorEgypt, Arab Rep.El SalvadorEquatorial GuineaEritreaEstoniaEthiopiaEuro areaEurope & Central AsiaEurope & Central Asia (excluding high income)Europe & Central Asia (IDA & IBRD countries)European UnionFijiFinlandFragile and conflict affected situationsFranceFrench PolynesiaGabonGambia, TheGeorgiaGermanyGhanaGreeceGuamGuatemalaGuineaGuinea-BissauGuyanaHaitiHeavily indebted poor countries (HIPC)High incomeHondurasHong Kong SAR, ChinaHungaryIBRD onlyIcelandIDA & IBRD totalIDA blendIDA onlyIDA totalIndiaIndonesiaIran, Islamic Rep.IraqIrelandIsraelItalyJamaicaJapanJordanKazakhstanKenyaKorea, Dem. People’s Rep.Korea, Rep.KuwaitKyrgyz RepublicLao PDRLate-demographic dividendLatin America & Caribbean Latin America & Caribbean (excluding high income)Latin America & the Caribbean (IDA & IBRD countries)LatviaLeast developed countries: UN classificationLebanonLesothoLiberiaLibyaLithuaniaLow & middle incomeLow incomeLower middle incomeLuxembourgMacao SAR, ChinaMacedonia, FYRMadagascarMalawiMalaysiaMaldivesMaliMaltaMauritaniaMauritiusMexicoMiddle East & North AfricaMiddle East & North Africa (excluding high income)Middle East & North Africa (IDA & IBRD countries)Middle incomeMoldovaMongoliaMontenegroMoroccoMozambiqueMyanmarNamibiaNepalNetherlandsNew CaledoniaNew ZealandNicaraguaNigerNigeriaNorth AmericaNorwayOECD membersOmanOther small statesPacific island small statesPakistanPanamaPapua New GuineaParaguayPeruPhilippinesPolandPortugalPost-demographic dividendPre-demographic dividendPuerto RicoQatarRomaniaRussian FederationRwandaSamoaSao Tome and PrincipeSaudi ArabiaSenegalSerbiaSierra LeoneSingaporeSlovak RepublicSloveniaSmall statesSolomon IslandsSomaliaSouth AfricaSouth AsiaSouth Asia (IDA & IBRD)SpainSri LankaSt. LuciaSt. Vincent and the GrenadinesSub-Saharan Africa Sub-Saharan Africa (excluding high income)Sub-Saharan Africa (IDA & IBRD countries)SudanSurinameSwazilandSwedenSwitzerlandSyrian Arab RepublicTajikistanTanzaniaThailandTimor-LesteTogoTongaTrinidad and TobagoTunisiaTurkeyTurkmenistanUgandaUkraineUnited Arab EmiratesUnited KingdomUnited StatesUpper middle incomeUruguayUzbekistanVanuatuVenezuela, RBVietnamVirgin Islands (U.S.)West Bank and GazaWorldYemen, Rep.ZambiaZimbabwe

La ligne de temps

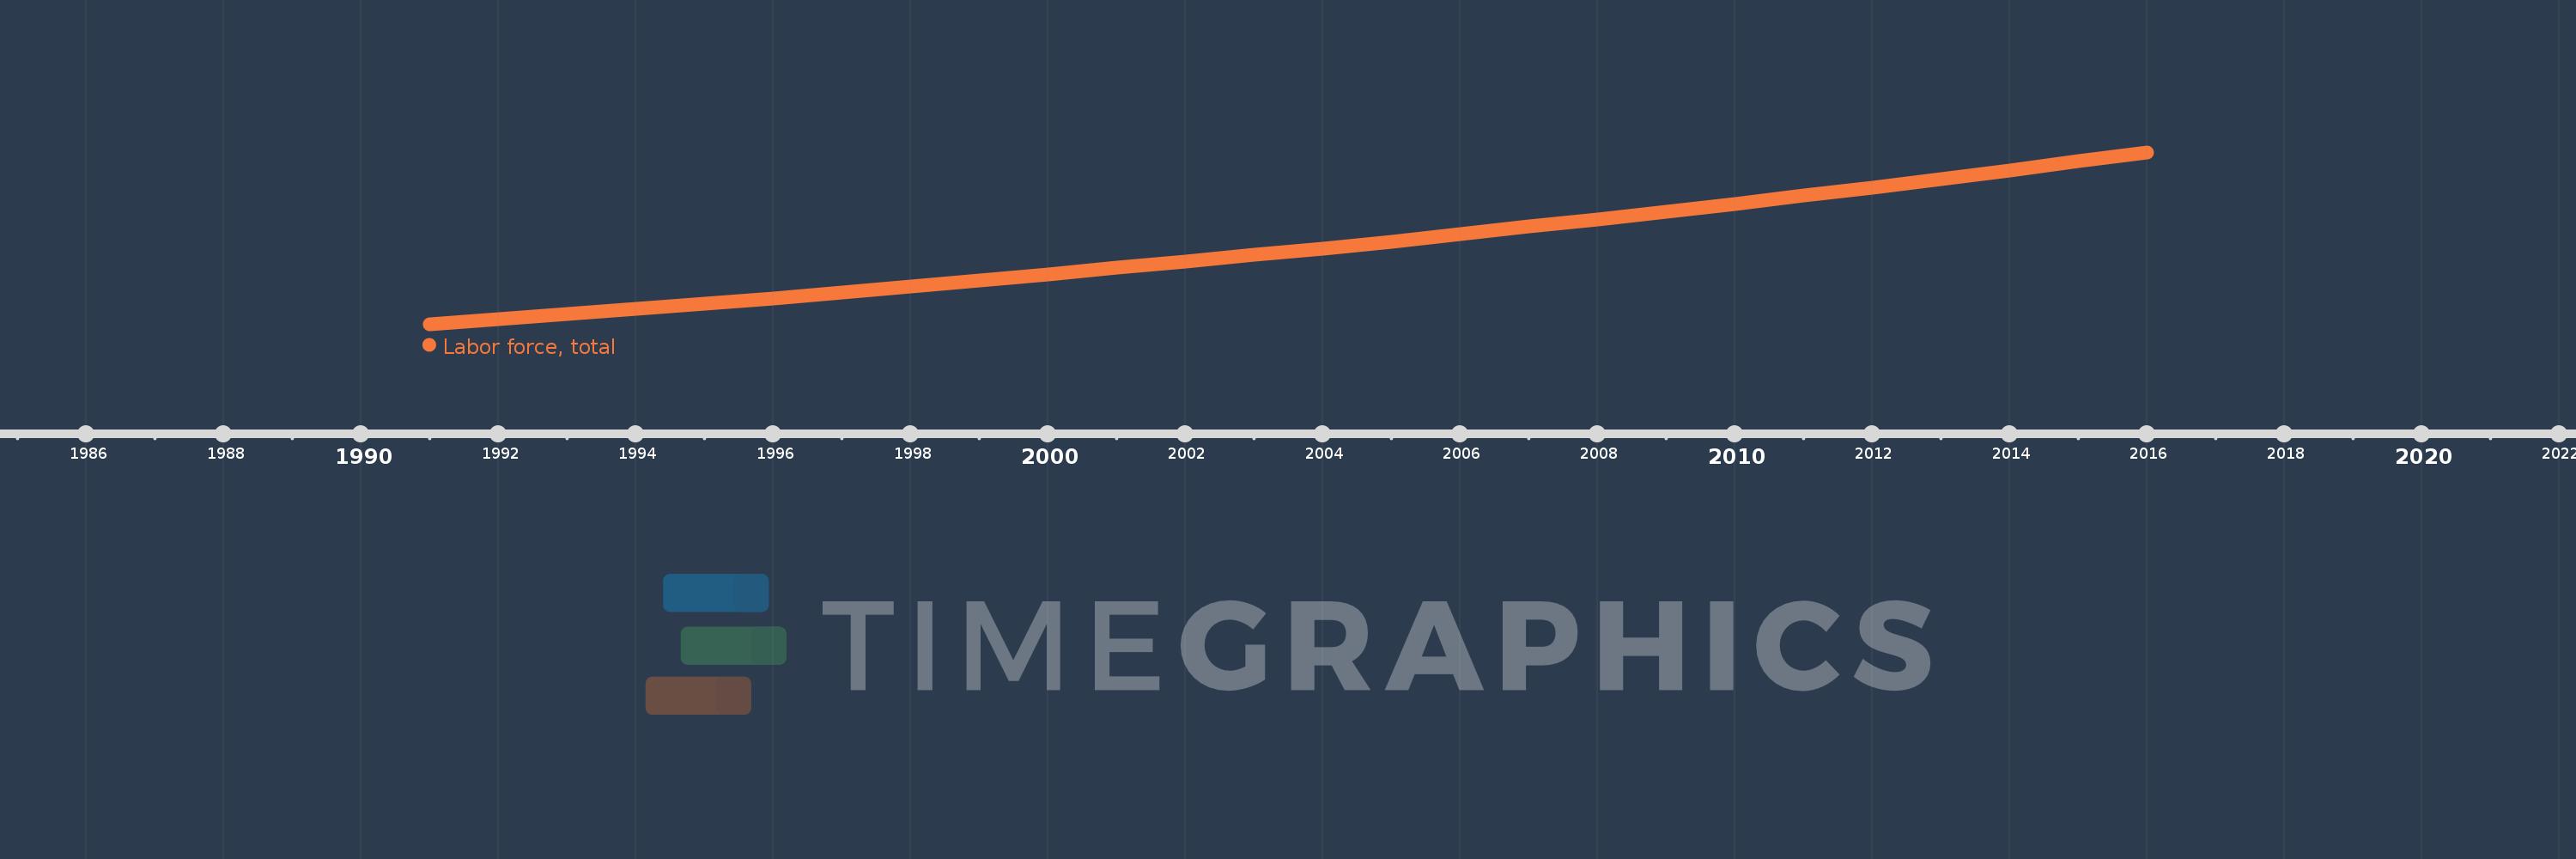
Cette échelle de temps montre un graphique de 1991 année à 2016 année IDA total. Les données jusqu'à 1990 année ne sont pas présentés. Quantité d'observations actuelles selon dates: 26.

Source (désignation):

Les indicateurs du développement mondiale

Source (organisation):

International Labour Organization, using World Bank population estimates.

Catégories:

Education, Social Protection & Labor

Dernière mise à jour

23 avr. 2017

Les indicateurs de changement de valeurs selon les années

En moyenne:
511.126 mln.
Minimum:
357.378 mln.
1 janv. 1991
Maximum:
698.683 mln.
1 janv. 2016
Pour la date d''observation
Valeur
Changement absolu
Le changement par rapport à la valeur précédente
1 janv. 1991
357.378 mln.
+357.378 mln.
0.0%
1 janv. 1992
367.137 mln.
+9.758 mln.
2.73%
1 janv. 1993
377.283 mln.
+10.146 mln.
2.76%
1 janv. 1994
387.438 mln.
+10.155 mln.
2.69%
1 janv. 1995
398.664 mln.
+11.226 mln.
2.9%
1 janv. 1996
409.18 mln.
+10.516 mln.
2.64%
1 janv. 1997
420.274 mln.
+11.095 mln.
2.71%
1 janv. 1998
432.016 mln.
+11.742 mln.
2.79%
1 janv. 1999
444.152 mln.
+12.136 mln.
2.81%
1 janv. 2000
456.346 mln.
+12.194 mln.
2.75%
1 janv. 2001
469.215 mln.
+12.869 mln.
2.82%
1 janv. 2002
481.662 mln.
+12.447 mln.
2.65%
1 janv. 2003
494.63 mln.
+12.968 mln.
2.69%
1 janv. 2004
508.048 mln.
+13.418 mln.
2.71%
1 janv. 2005
521.871 mln.
+13.823 mln.
2.72%
1 janv. 2006
537.028 mln.
+15.157 mln.
2.9%
1 janv. 2007
552.357 mln.
+15.328 mln.
2.85%
1 janv. 2008
566.21 mln.
+13.853 mln.
2.51%
1 janv. 2009
581.043 mln.
+14.833 mln.
2.62%
1 janv. 2010
596.778 mln.
+15.736 mln.
2.71%
1 janv. 2011
613.152 mln.
+16.374 mln.
2.74%
1 janv. 2012
629.318 mln.
+16.166 mln.
2.64%
1 janv. 2013
645.844 mln.
+16.526 mln.
2.63%
1 janv. 2014
662.963 mln.
+17.119 mln.
2.65%
1 janv. 2015
680.603 mln.
+17.639 mln.
2.66%
1 janv. 2016
698.683 mln.
+18.081 mln.
2.66%

Classement des pays selon les statistiques actuelles par années