29
/fr/
fr
AIzaSyAYiBZKx7MnpbEhh9jyipgxe19OcubqV5w
April 1, 2024
39897
IDA total
IDA
false
2
1
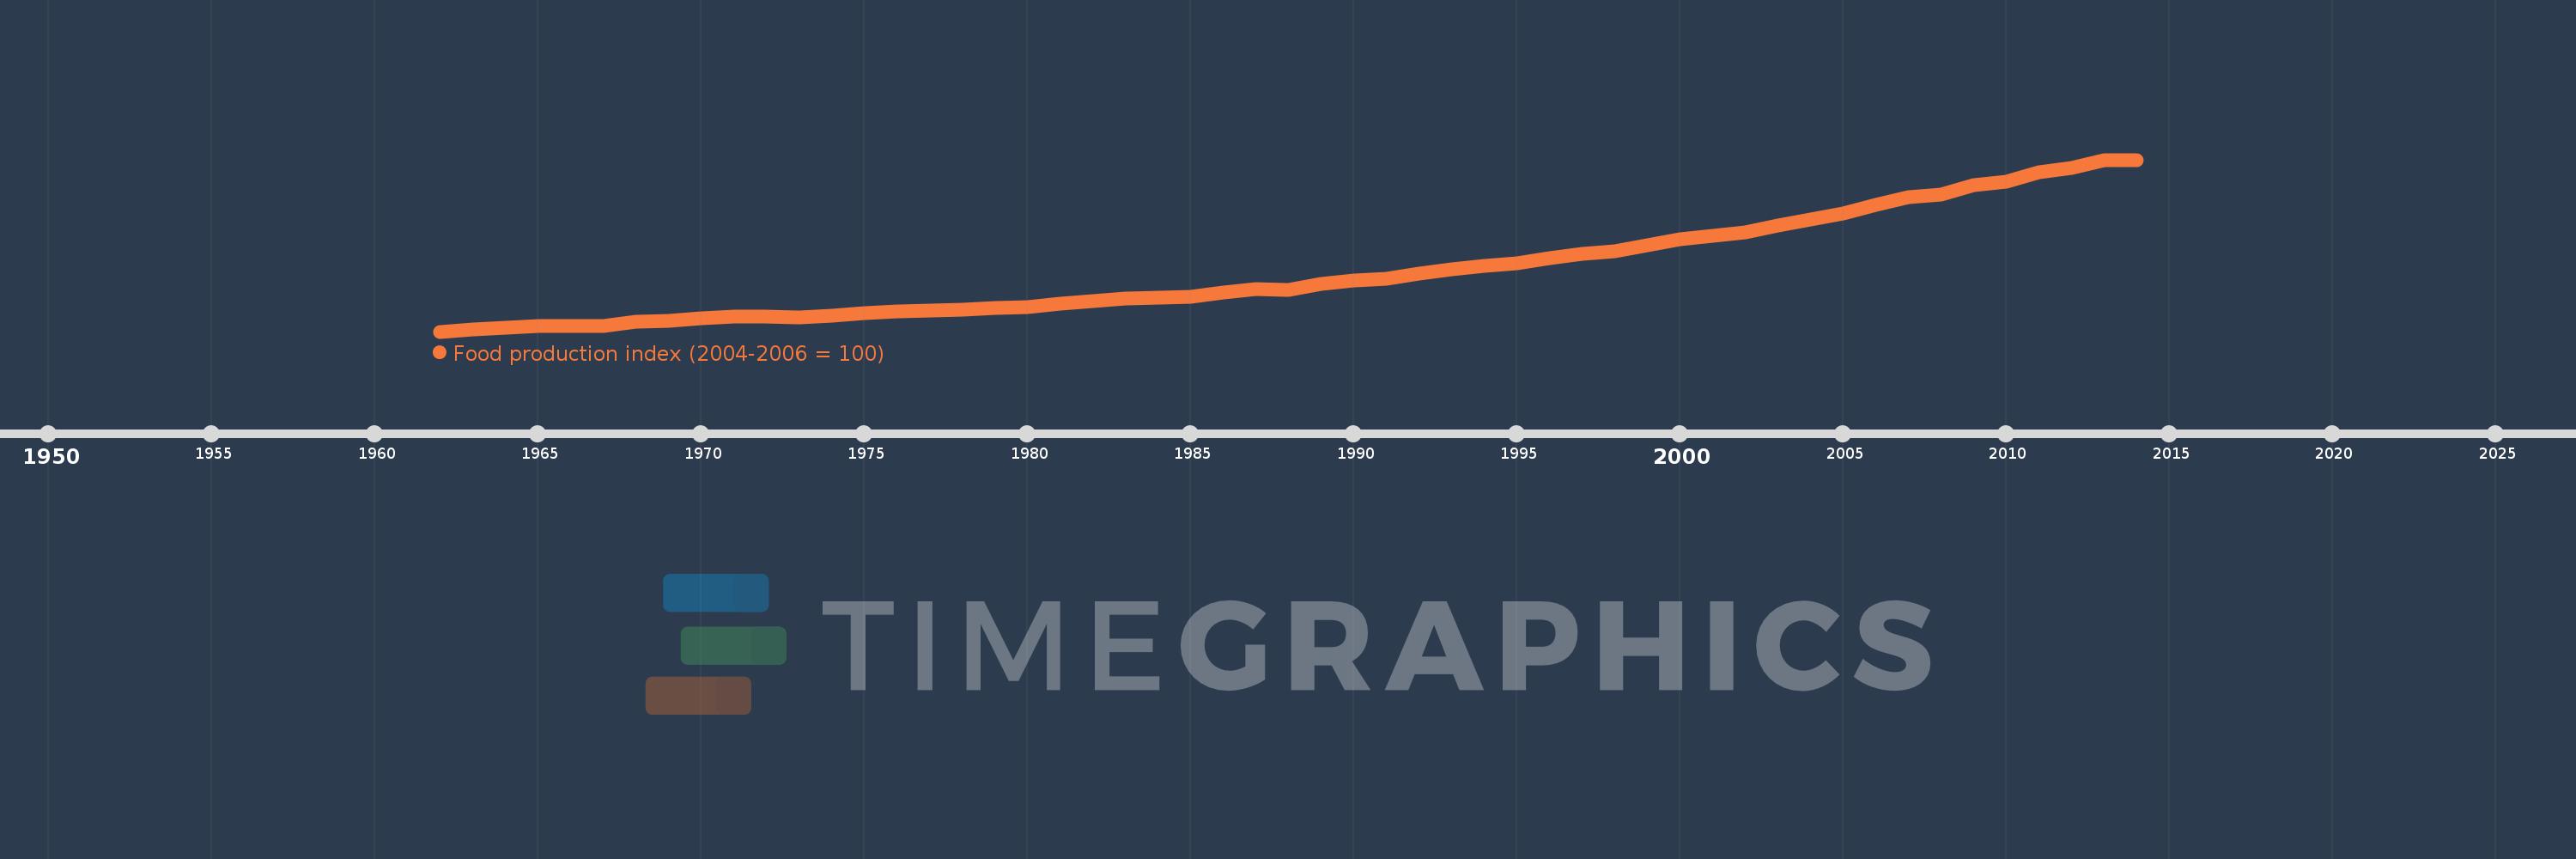
Food production index (2004-2006 = 100)
2014,2013,2012,2011,2010,2009,2008,2007,2006,2005,2004,2003,2002,2001,2000,1999,1998,1997,1996,1995,1994,1993,1992,1991,1990,1989,1988,1987,1986,1985,1984,1983,1982,1981,1980,1979,1978,1977,1976,1975,1974,1973,1972,1971,1970,1969,1968,1967,1966,1965,1964,1963,1962
Cette statistique dans les autres pays:
AfghanistanAlbaniaAlgeriaAmerican SamoaAngolaAntigua and BarbudaArab WorldArgentinaArmeniaAustraliaAustriaAzerbaijanBahamas, TheBahrainBangladeshBarbadosBelarusBelgiumBelizeBeninBermudaBhutanBoliviaBosnia and HerzegovinaBotswanaBrazilBritish Virgin IslandsBrunei DarussalamBulgariaBurkina FasoBurundiCabo VerdeCambodiaCameroonCanadaCaribbean small statesCayman IslandsCentral African RepublicCentral Europe and the BalticsChadChileChinaColombiaComorosCongo, Dem. Rep.Congo, Rep.Costa RicaCote d'IvoireCroatiaCubaCyprusCzech RepublicDenmarkDjiboutiDominicaDominican RepublicEarly-demographic dividendEast Asia & PacificEast Asia & Pacific (excluding high income)East Asia & Pacific (IDA & IBRD countries)EcuadorEgypt, Arab Rep.El SalvadorEquatorial GuineaEritreaEstoniaEthiopiaEuro areaEurope & Central AsiaEurope & Central Asia (excluding high income)Europe & Central Asia (IDA & IBRD countries)European UnionFaroe IslandsFijiFinlandFragile and conflict affected situationsFranceFrench PolynesiaGabonGambia, TheGeorgiaGermanyGhanaGreeceGreenlandGrenadaGuamGuatemalaGuineaGuinea-BissauGuyanaHaitiHeavily indebted poor countries (HIPC)High incomeHondurasHong Kong SAR, ChinaHungaryIBRD onlyIcelandIDA & IBRD totalIDA blendIDA onlyIDA totalIndiaIndonesiaIran, Islamic Rep.IraqIrelandIsraelItalyJamaicaJapanJordanKazakhstanKenyaKiribatiKorea, Dem. People’s Rep.Korea, Rep.KuwaitKyrgyz RepublicLao PDRLate-demographic dividendLatin America & Caribbean Latin America & Caribbean (excluding high income)Latin America & the Caribbean (IDA & IBRD countries)LatviaLeast developed countries: UN classificationLebanonLesothoLiberiaLibyaLiechtensteinLithuaniaLow & middle incomeLow incomeLower middle incomeLuxembourgMacao SAR, ChinaMacedonia, FYRMadagascarMalawiMalaysiaMaldivesMaliMaltaMarshall IslandsMauritaniaMauritiusMexicoMicronesia, Fed. Sts.Middle East & North AfricaMiddle East & North Africa (excluding high income)Middle East & North Africa (IDA & IBRD countries)Middle incomeMoldovaMongoliaMontenegroMoroccoMozambiqueMyanmarNamibiaNauruNepalNetherlandsNew CaledoniaNew ZealandNicaraguaNigerNigeriaNorth AmericaNorwayOECD membersOmanOther small statesPacific island small statesPakistanPanamaPapua New GuineaParaguayPeruPhilippinesPolandPortugalPost-demographic dividendPre-demographic dividendPuerto RicoQatarRomaniaRussian FederationRwandaSamoaSao Tome and PrincipeSaudi ArabiaSenegalSerbiaSeychellesSierra LeoneSingaporeSlovak RepublicSloveniaSmall statesSolomon IslandsSomaliaSouth AfricaSouth AsiaSouth Asia (IDA & IBRD)SpainSri LankaSt. Kitts and NevisSt. LuciaSt. Vincent and the GrenadinesSub-Saharan Africa Sub-Saharan Africa (excluding high income)Sub-Saharan Africa (IDA & IBRD countries)SudanSurinameSwazilandSwedenSwitzerlandSyrian Arab RepublicTajikistanTanzaniaThailandTimor-LesteTogoTongaTrinidad and TobagoTunisiaTurkeyTurkmenistanTuvaluUgandaUkraineUnited Arab EmiratesUnited KingdomUnited StatesUpper middle incomeUruguayUzbekistanVanuatuVenezuela, RBVietnamVirgin Islands (U.S.)West Bank and GazaWorldYemen, Rep.ZambiaZimbabwe La ligne de temps
Cette échelle de temps montre un graphique de 1962 année à 2014 année IDA total. Les données jusqu'à 1961 année ne sont pas présentés. Quantité d'observations actuelles selon dates: 53.
Source (désignation):
Les indicateurs du développement mondiale
Source (organisation):
Food and Agriculture Organization, electronic files and web site.
Catégories:
Agriculture & Rural Development
Dernière mise à jour
23 avr. 2017
Les indicateurs de changement de valeurs selon les années
Minimum:
27.832
1 janv. 1962
Maximum:
125.929
1 janv. 2013
Pour la date d''observation
Valeur
Changement absolu
Le changement par rapport à la valeur précédente
1 janv. 1962
27.832
+27.832
0.0%
1 janv. 1963
28.85
+1.018
3.66%
1 janv. 1964
29.894
+1.044
3.62%
1 janv. 1965
30.802
+0.908
3.04%
1 janv. 1966
31.101
+0.299
0.97%
1 janv. 1967
31.002
-0.098
-0.32%
1 janv. 1968
33.248
+2.246
7.24%
1 janv. 1969
33.873
+0.625
1.88%
1 janv. 1970
35.271
+1.398
4.13%
1 janv. 1971
36.435
+1.164
3.3%
1 janv. 1972
36.266
-0.169
-0.46%
1 janv. 1973
36.013
-0.253
-0.7%
1 janv. 1974
36.662
+0.649
1.8%
1 janv. 1975
38.386
+1.724
4.7%
1 janv. 1976
39.32
+0.934
2.43%
1 janv. 1977
39.94
+0.62
1.58%
1 janv. 1978
40.365
+0.425
1.06%
1 janv. 1979
41.488
+1.122
2.78%
1 janv. 1980
42.004
+0.517
1.25%
1 janv. 1981
43.792
+1.788
4.26%
1 janv. 1982
45.378
+1.586
3.62%
1 janv. 1983
46.601
+1.223
2.7%
1 janv. 1984
47.38
+0.779
1.67%
1 janv. 1985
47.811
+0.431
0.91%
1 janv. 1986
50.044
+2.233
4.67%
1 janv. 1987
51.965
+1.921
3.84%
1 janv. 1988
51.86
-0.104
-0.2%
1 janv. 1989
54.921
+3.06
5.9%
1 janv. 1990
56.773
+1.852
3.37%
1 janv. 1991
58.038
+1.265
2.23%
1 janv. 1992
60.732
+2.694
4.64%
1 janv. 1993
63.336
+2.604
4.29%
1 janv. 1994
65.402
+2.065
3.26%
1 janv. 1995
66.717
+1.315
2.01%
1 janv. 1996
69.582
+2.864
4.29%
1 janv. 1997
72.315
+2.734
3.93%
1 janv. 1998
73.484
+1.168
1.62%
1 janv. 1999
76.918
+3.435
4.67%
1 janv. 2000
80.322
+3.404
4.42%
1 janv. 2001
82.385
+2.063
2.57%
1 janv. 2002
84.271
+1.887
2.29%
1 janv. 2003
88.192
+3.921
4.65%
1 janv. 2004
91.96
+3.767
4.27%
1 janv. 2005
95.22
+3.26
3.55%
1 janv. 2006
100.24
+5.02
5.27%
1 janv. 2007
104.541
+4.301
4.29%
1 janv. 2008
105.868
+1.327
1.27%
1 janv. 2009
111.621
+5.754
5.43%
1 janv. 2010
113.228
+1.607
1.44%
1 janv. 2011
118.975
+5.746
5.08%
1 janv. 2012
121.079
+2.104
1.77%
1 janv. 2013
125.929
+4.85
4.01%
1 janv. 2014
125.528
-0.401
-0.32%
Classement des pays selon les statistiques actuelles par années


Commentaires: