29
/fr/
fr
AIzaSyAYiBZKx7MnpbEhh9jyipgxe19OcubqV5w
April 1, 2024
39750
IDA total
IDA
false
2
1
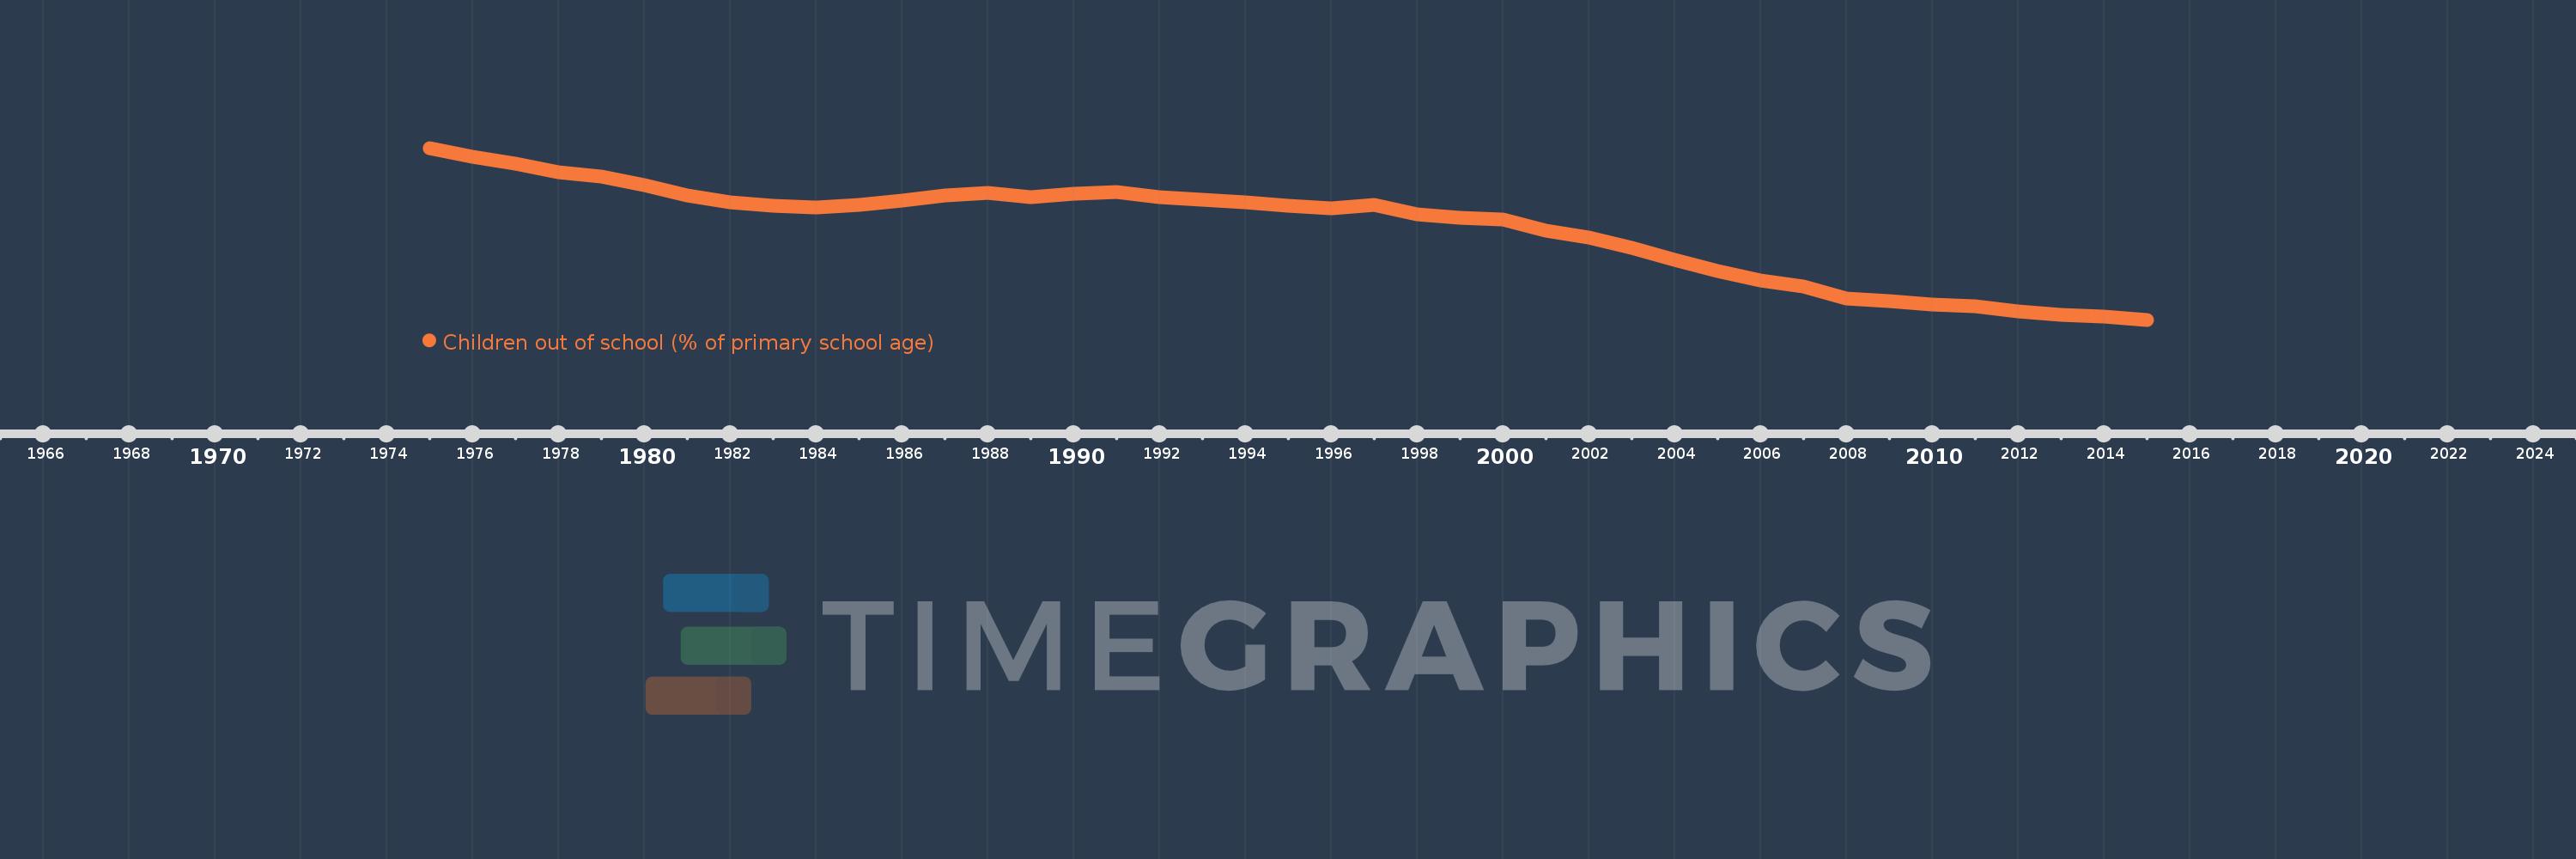
Children out of school (% of primary school age)
2015,2014,2013,2012,2011,2010,2009,2008,2007,2006,2005,2004,2003,2002,2001,2000,1999,1998,1997,1996,1995,1994,1993,1992,1991,1990,1989,1988,1987,1986,1985,1984,1983,1982,1981,1980,1979,1978,1977,1976,1975
Cette statistique dans les autres pays:
AfghanistanAlbaniaAlgeriaAngolaAntigua and BarbudaArab WorldArgentinaArmeniaArubaAustraliaAustriaAzerbaijanBahamas, TheBahrainBangladeshBarbadosBelarusBelgiumBelizeBeninBermudaBhutanBoliviaBosnia and HerzegovinaBotswanaBrazilBrunei DarussalamBulgariaBurkina FasoBurundiCabo VerdeCambodiaCameroonCanadaCaribbean small statesCentral African RepublicCentral Europe and the BalticsChadChileChinaColombiaComorosCongo, Dem. Rep.Congo, Rep.Costa RicaCote d'IvoireCroatiaCubaCyprusDenmarkDjiboutiDominicaDominican RepublicEarly-demographic dividendEast Asia & PacificEast Asia & Pacific (excluding high income)East Asia & Pacific (IDA & IBRD countries)EcuadorEgypt, Arab Rep.El SalvadorEquatorial GuineaEritreaEstoniaEthiopiaEuro areaEurope & Central AsiaEurope & Central Asia (excluding high income)Europe & Central Asia (IDA & IBRD countries)European UnionFijiFinlandFragile and conflict affected situationsFranceGabonGambia, TheGeorgiaGermanyGhanaGreeceGrenadaGuatemalaGuineaGuinea-BissauGuyanaHaitiHeavily indebted poor countries (HIPC)High incomeHondurasHong Kong SAR, ChinaHungaryIBRD onlyIcelandIDA & IBRD totalIDA blendIDA onlyIDA totalIndiaIndonesiaIran, Islamic Rep.IraqIrelandIsraelItalyJamaicaJapanJordanKazakhstanKenyaKiribatiKorea, Dem. People’s Rep.Korea, Rep.KuwaitKyrgyz RepublicLao PDRLate-demographic dividendLatin America & Caribbean Latin America & Caribbean (excluding high income)Latin America & the Caribbean (IDA & IBRD countries)LatviaLeast developed countries: UN classificationLebanonLesothoLiberiaLibyaLiechtensteinLithuaniaLow & middle incomeLow incomeLower middle incomeLuxembourgMacao SAR, ChinaMacedonia, FYRMadagascarMalawiMalaysiaMaldivesMaliMaltaMarshall IslandsMauritaniaMauritiusMexicoMicronesia, Fed. Sts.Middle East & North AfricaMiddle East & North Africa (excluding high income)Middle East & North Africa (IDA & IBRD countries)Middle incomeMoldovaMongoliaMontenegroMoroccoMozambiqueMyanmarNamibiaNauruNepalNetherlandsNew ZealandNicaraguaNigerNigeriaNorth AmericaNorwayOECD membersOmanOther small statesPacific island small statesPakistanPalauPanamaPapua New GuineaParaguayPeruPhilippinesPolandPortugalPost-demographic dividendPre-demographic dividendPuerto RicoQatarRomaniaRussian FederationRwandaSamoaSan MarinoSao Tome and PrincipeSaudi ArabiaSenegalSerbiaSeychellesSierra LeoneSloveniaSmall statesSolomon IslandsSomaliaSouth AfricaSouth AsiaSouth Asia (IDA & IBRD)South SudanSpainSri LankaSt. Kitts and NevisSt. LuciaSt. Vincent and the GrenadinesSub-Saharan Africa Sub-Saharan Africa (excluding high income)Sub-Saharan Africa (IDA & IBRD countries)SudanSurinameSwazilandSwedenSwitzerlandSyrian Arab RepublicTajikistanTanzaniaThailandTimor-LesteTogoTongaTrinidad and TobagoTunisiaTurkeyTuvaluUgandaUkraineUnited Arab EmiratesUnited KingdomUnited StatesUpper middle incomeUruguayUzbekistanVanuatuVenezuela, RBVietnamWest Bank and GazaWorldYemen, Rep.ZambiaZimbabwe La ligne de temps
Cette échelle de temps montre un graphique de 1975 année à 2015 année IDA total. Les données jusqu'à 1974 année ne sont pas présentés. Quantité d'observations actuelles selon dates: 41.
Source (désignation):
Les indicateurs du développement mondiale
Source (organisation):
United Nations Educational, Scientific, and Cultural Organization (UNESCO) Institute for Statistics.
Catégories:
Education
Dernière mise à jour
23 avr. 2017
Les indicateurs de changement de valeurs selon les années
Minimum:
19.21
1 janv. 2015
Maximum:
49.379
1 janv. 1975
Pour la date d''observation
Valeur
Changement absolu
Le changement par rapport à la valeur précédente
1 janv. 1975
49.379
+49.379
0.0%
1 janv. 1976
47.875
-1.504
-3.05%
1 janv. 1977
46.637
-1.238
-2.59%
1 janv. 1978
45.088
-1.549
-3.32%
1 janv. 1979
44.425
-0.663
-1.47%
1 janv. 1980
42.885
-1.54
-3.47%
1 janv. 1981
41.002
-1.883
-4.39%
1 janv. 1982
39.775
-1.227
-2.99%
1 janv. 1983
39.289
-0.486
-1.22%
1 janv. 1984
38.947
-0.342
-0.87%
1 janv. 1985
39.335
+0.388
1.0%
1 janv. 1986
40.09
+0.755
1.92%
1 janv. 1987
41.091
+1.001
2.5%
1 janv. 1988
41.453
+0.362
0.88%
1 janv. 1989
40.744
-0.71
-1.71%
1 janv. 1990
41.279
+0.535
1.31%
1 janv. 1991
41.679
+0.399
0.97%
1 janv. 1992
40.692
-0.986
-2.37%
1 janv. 1993
40.357
-0.335
-0.82%
1 janv. 1994
39.812
-0.546
-1.35%
1 janv. 1995
39.258
-0.553
-1.39%
1 janv. 1996
38.725
-0.533
-1.36%
1 janv. 1997
39.306
+0.581
1.5%
1 janv. 1998
37.73
-1.576
-4.01%
1 janv. 1999
37.115
-0.615
-1.63%
1 janv. 2000
36.791
-0.325
-0.87%
1 janv. 2001
34.91
-1.881
-5.11%
1 janv. 2002
33.602
-1.308
-3.75%
1 janv. 2003
31.887
-1.715
-5.1%
1 janv. 2004
29.781
-2.106
-6.61%
1 janv. 2005
27.776
-2.005
-6.73%
1 janv. 2006
26.062
-1.714
-6.17%
1 janv. 2007
25.006
-1.056
-4.05%
1 janv. 2008
22.984
-2.021
-8.08%
1 janv. 2009
22.45
-0.534
-2.32%
1 janv. 2010
21.868
-0.582
-2.59%
1 janv. 2011
21.599
-0.268
-1.23%
1 janv. 2012
20.696
-0.904
-4.18%
1 janv. 2013
20.111
-0.585
-2.82%
1 janv. 2014
19.737
-0.374
-1.86%
1 janv. 2015
19.21
-0.527
-2.67%
Classement des pays selon les statistiques actuelles par années


Commentaires: