29
/fr/
fr
AIzaSyAYiBZKx7MnpbEhh9jyipgxe19OcubqV5w
April 1, 2024
37598
IDA & IBRD total
IBT
false
2
1
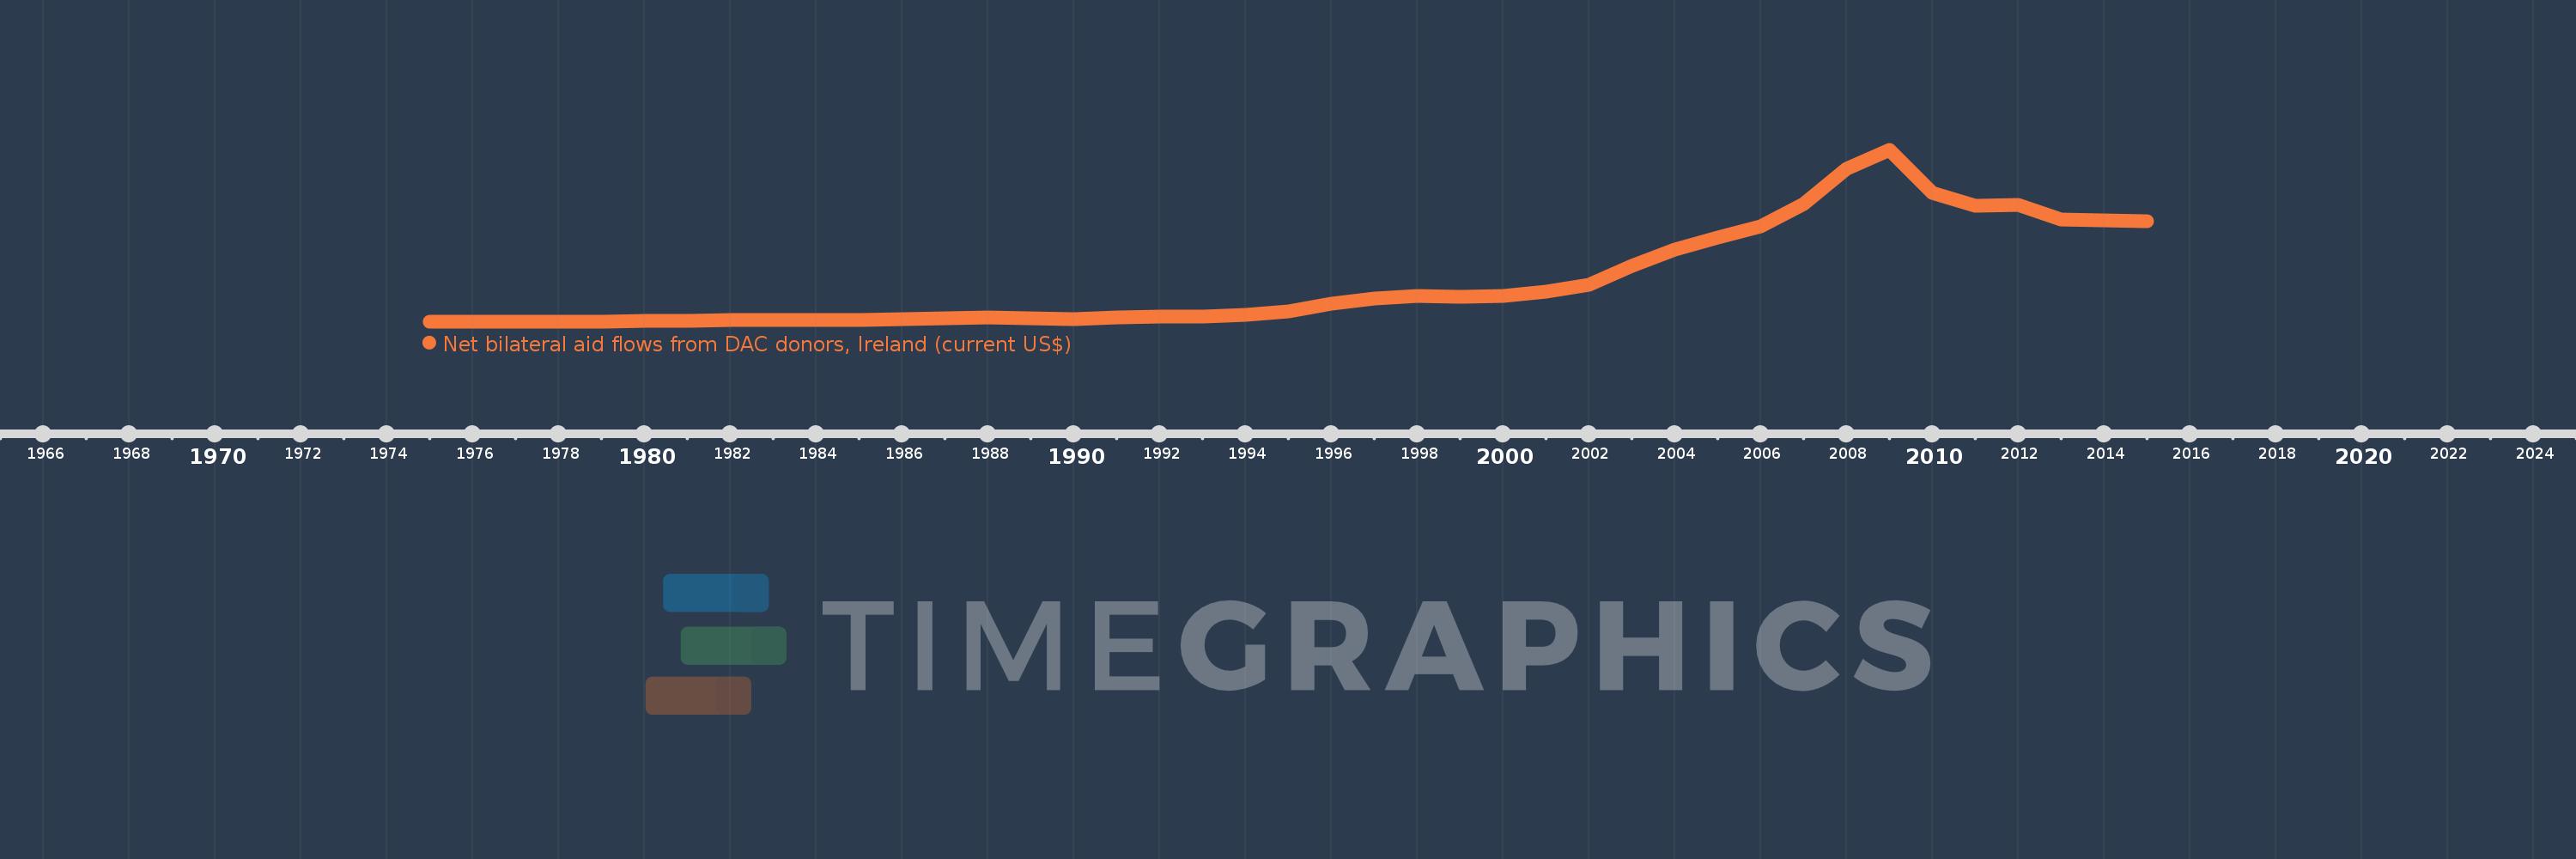
Net bilateral aid flows from DAC donors, Ireland (current US$)
2015,2014,2013,2012,2011,2010,2009,2008,2007,2006,2005,2004,2003,2002,2001,2000,1999,1998,1997,1996,1995,1994,1993,1992,1991,1990,1989,1988,1987,1986,1985,1984,1983,1982,1981,1980,1979,1978,1977,1976,1975
Cette statistique dans les autres pays:
AfghanistanAlbaniaAlgeriaAngolaArab WorldArgentinaArmeniaAzerbaijanBangladeshBelarusBelizeBeninBhutanBoliviaBosnia and HerzegovinaBotswanaBrazilBulgariaBurkina FasoBurundiCambodiaCameroonCaribbean small statesCentral African RepublicCentral Europe and the BalticsChadChileChinaColombiaComorosCongo, Dem. Rep.Congo, Rep.Costa RicaCote d'IvoireCroatiaCubaCzech RepublicDjiboutiDominican RepublicEast Asia & PacificEast Asia & Pacific (excluding high income)East Asia & Pacific (IDA & IBRD countries)EcuadorEgypt, Arab Rep.El SalvadorEquatorial GuineaEritreaEthiopiaEuro areaEurope & Central AsiaEurope & Central Asia (excluding high income)Europe & Central Asia (IDA & IBRD countries)European UnionFijiFragile and conflict affected situationsGabonGambia, TheGeorgiaGhanaGrenadaGuatemalaGuineaGuinea-BissauGuyanaHaitiHeavily indebted poor countries (HIPC)High incomeHondurasHong Kong SAR, ChinaHungaryIBRD onlyIDA & IBRD totalIDA blendIDA onlyIDA totalIndiaIndonesiaIran, Islamic Rep.IraqIsraelJamaicaJordanKazakhstanKenyaKorea, Dem. People’s Rep.Korea, Rep.KosovoKyrgyz RepublicLao PDRLatin America & Caribbean Latin America & Caribbean (excluding high income)Latin America & the Caribbean (IDA & IBRD countries)LatviaLeast developed countries: UN classificationLebanonLesothoLiberiaLibyaLithuaniaLow & middle incomeLow incomeLower middle incomeMacedonia, FYRMadagascarMalawiMalaysiaMaldivesMaliMauritaniaMauritiusMexicoMicronesia, Fed. Sts.Middle East & North AfricaMiddle East & North Africa (excluding high income)Middle East & North Africa (IDA & IBRD countries)Middle incomeMoldovaMongoliaMontenegroMoroccoMozambiqueMyanmarNamibiaNepalNicaraguaNigerNigeriaOECD membersOther small statesPacific island small statesPakistanPanamaPapua New GuineaParaguayPeruPhilippinesPolandRomaniaRussian FederationRwandaSamoaSao Tome and PrincipeSenegalSerbiaSeychellesSierra LeoneSlovak RepublicSloveniaSmall statesSolomon IslandsSomaliaSouth AfricaSouth AsiaSouth Asia (IDA & IBRD)South SudanSri LankaSt. LuciaSub-Saharan Africa Sub-Saharan Africa (excluding high income)Sub-Saharan Africa (IDA & IBRD countries)SudanSurinameSwazilandSyrian Arab RepublicTajikistanTanzaniaThailandTimor-LesteTogoTrinidad and TobagoTunisiaTurkeyTurkmenistanUgandaUkraineUpper middle incomeUruguayUzbekistanVanuatuVenezuela, RBVietnamWest Bank and GazaWorldYemen, Rep.ZambiaZimbabwe La ligne de temps
Cette échelle de temps montre un graphique de 1975 année à 2015 année IDA & IBRD total. Les données jusqu'à 1974 année ne sont pas présentés. Quantité d'observations actuelles selon dates: 41.
Source (désignation):
Les indicateurs du développement mondiale
Source (organisation):
Development Assistance Committee of the Organisation for Economic Co-operation and Development, Geographical Distribution of Financial Flows to Developing Countries, Development Co-operation Report, and International Development Statistics database. Data are available online at: www.oecd.org/dac/stats/idsonline.
Catégories:
Aid Effectiveness
Dernière mise à jour
23 avr. 2017
Les indicateurs de changement de valeurs selon les années
Minimum:
240.0 milles
1 janv. 1976
Maximum:
677.04 mln.
1 janv. 2009
Pour la date d''observation
Valeur
Changement absolu
Le changement par rapport à la valeur précédente
1 janv. 1975
450.0 milles
+450.0 milles
0.0%
1 janv. 1976
240.0 milles
-210.0 milles
-46.67%
1 janv. 1977
640.0 milles
+400.0 milles
166.67%
1 janv. 1978
950.0 milles
+310.0 milles
48.44%
1 janv. 1979
2.66 mln.
+1.71 mln.
180.0%
1 janv. 1980
4.29 mln.
+1.63 mln.
61.28%
1 janv. 1981
6.22 mln.
+1.93 mln.
44.99%
1 janv. 1982
6.92 mln.
+700.0 milles
11.25%
1 janv. 1983
8.36 mln.
+1.44 mln.
20.81%
1 janv. 1984
9.14 mln.
+780.0 milles
9.33%
1 janv. 1985
8.83 mln.
-310.0 milles
-3.39%
1 janv. 1986
11.32 mln.
+2.49 mln.
28.2%
1 janv. 1987
14.54 mln.
+3.22 mln.
28.45%
1 janv. 1988
16.68 mln.
+2.14 mln.
14.72%
1 janv. 1989
14.98 mln.
-1.7 mln.
-10.19%
1 janv. 1990
12.49 mln.
-2.49 mln.
-16.62%
1 janv. 1991
16.95 mln.
+4.46 mln.
35.71%
1 janv. 1992
21.68 mln.
+4.73 mln.
27.91%
1 janv. 1993
20.99 mln.
-690.0 milles
-3.18%
1 janv. 1994
29.09 mln.
+8.1 mln.
38.59%
1 janv. 1995
41.97 mln.
+12.88 mln.
44.28%
1 janv. 1996
71.04 mln.
+29.07 mln.
69.26%
1 janv. 1997
91.76 mln.
+20.72 mln.
29.17%
1 janv. 1998
102.28 mln.
+10.52 mln.
11.46%
1 janv. 1999
98.73 mln.
-3.55 mln.
-3.47%
1 janv. 2000
103.99 mln.
+5.26 mln.
5.33%
1 janv. 2001
121.23 mln.
+17.24 mln.
16.58%
1 janv. 2002
146.88 mln.
+25.65 mln.
21.16%
1 janv. 2003
221.31 mln.
+74.43 mln.
50.67%
1 janv. 2004
286.03 mln.
+64.72 mln.
29.24%
1 janv. 2005
331.57 mln.
+45.54 mln.
15.92%
1 janv. 2006
377.38 mln.
+45.81 mln.
13.82%
1 janv. 2007
466.09 mln.
+88.71 mln.
23.51%
1 janv. 2008
603.5 mln.
+137.41 mln.
29.48%
1 janv. 2009
677.04 mln.
+73.54 mln.
12.19%
1 janv. 2010
507.44 mln.
-169.6 mln.
-25.05%
1 janv. 2011
458.98 mln.
-48.46 mln.
-9.55%
1 janv. 2012
461.85 mln.
+2.87 mln.
0.63%
1 janv. 2013
402.72 mln.
-59.13 mln.
-12.8%
1 janv. 2014
401.24 mln.
-1.48 mln.
-0.37%
1 janv. 2015
397.04 mln.
-4.2 mln.
-1.05%
Classement des pays selon les statistiques actuelles par années


Commentaires: