29
/fr/
fr
AIzaSyAYiBZKx7MnpbEhh9jyipgxe19OcubqV5w
April 1, 2024
37595
IDA & IBRD total
IBT
false
2
1
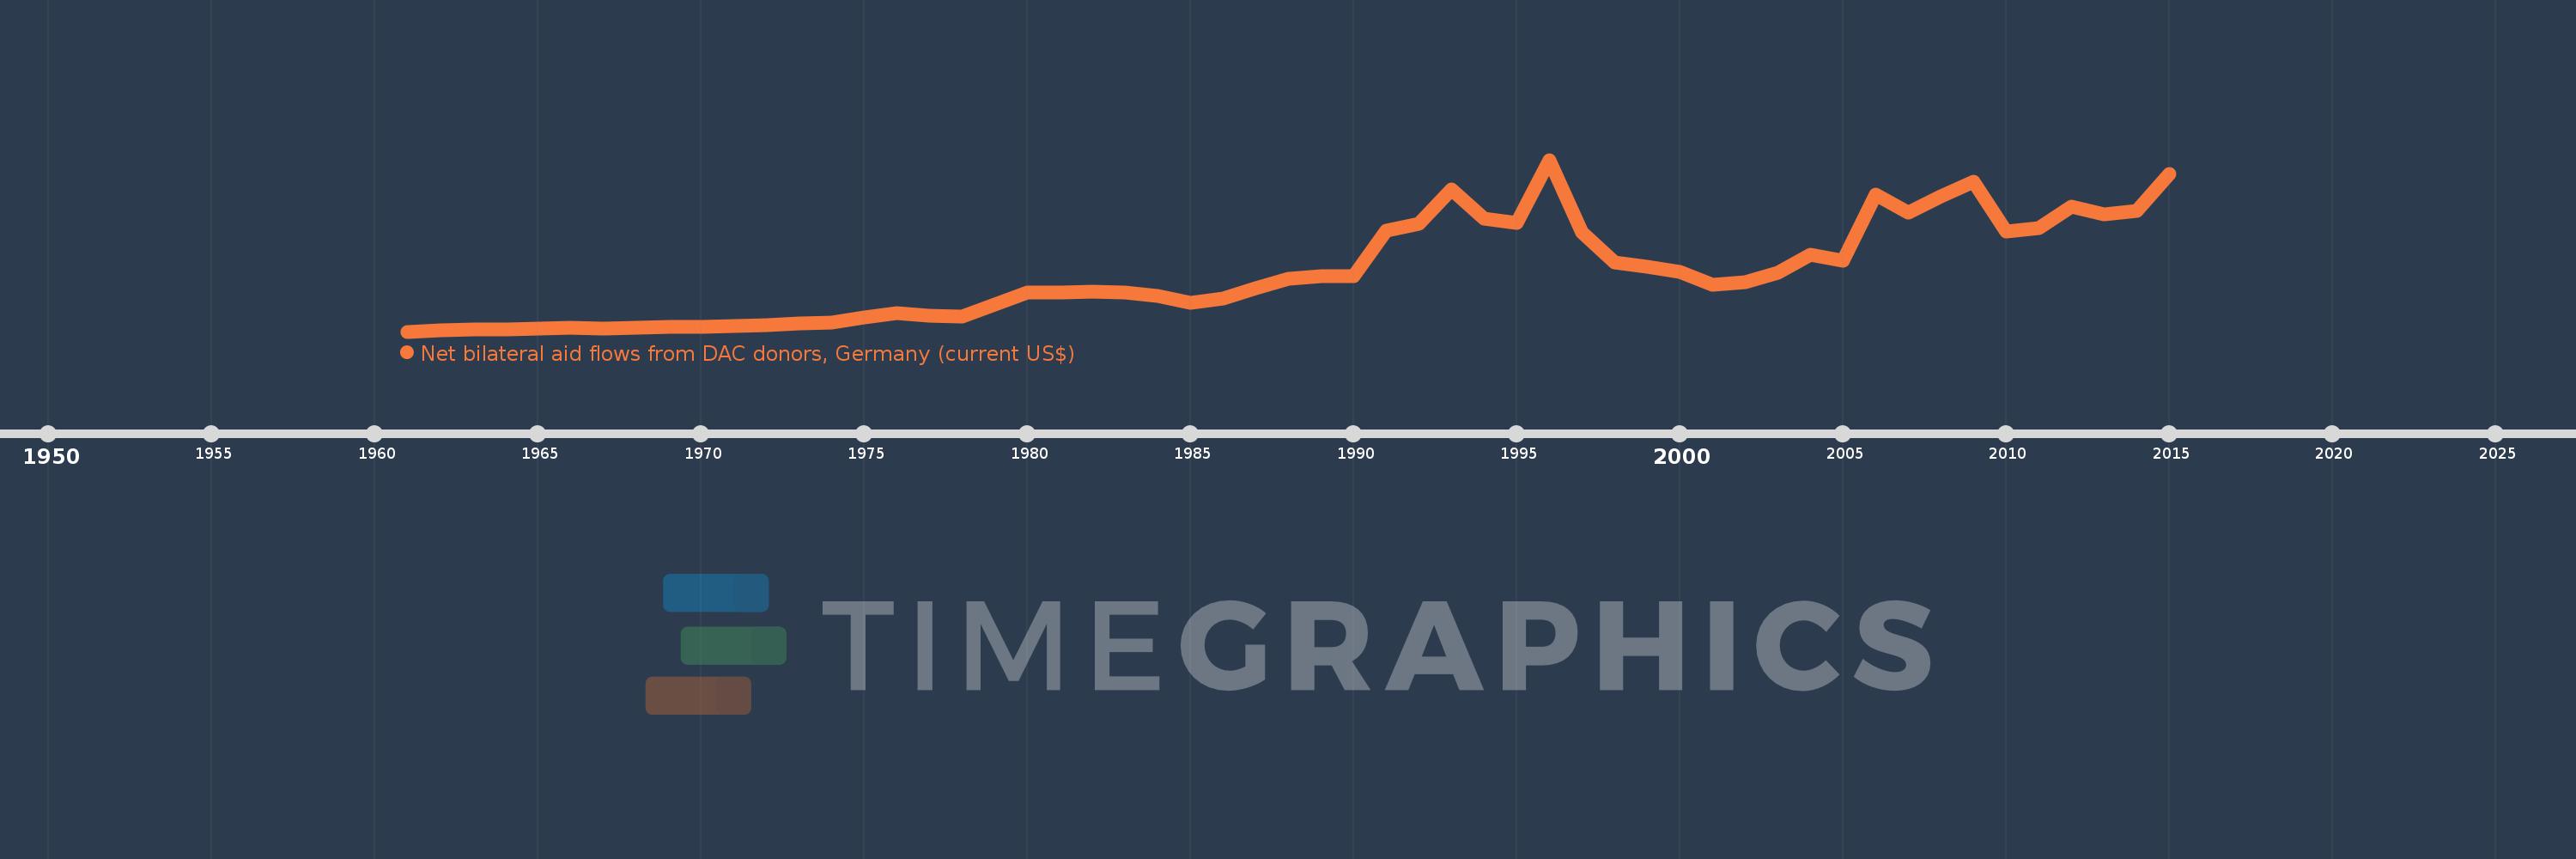
Net bilateral aid flows from DAC donors, Germany (current US$)
2015,2014,2013,2012,2011,2010,2009,2008,2007,2006,2005,2004,2003,2002,2001,2000,1999,1998,1997,1996,1995,1994,1993,1992,1991,1990,1989,1988,1987,1986,1985,1984,1983,1982,1981,1980,1979,1978,1977,1976,1975,1974,1973,1972,1971,1970,1969,1968,1967,1966,1965,1964,1963,1962,1961
Cette statistique dans les autres pays:
AfghanistanAlbaniaAlgeriaAngolaAntigua and BarbudaArab WorldArgentinaArmeniaAzerbaijanBahamas, TheBahrainBangladeshBarbadosBelarusBelizeBeninBermudaBhutanBoliviaBosnia and HerzegovinaBotswanaBrazilBritish Virgin IslandsBrunei DarussalamBulgariaBurkina FasoBurundiCabo VerdeCambodiaCameroonCaribbean small statesCayman IslandsCentral African RepublicCentral Europe and the BalticsChadChileChinaColombiaComorosCongo, Dem. Rep.Congo, Rep.Costa RicaCote d'IvoireCroatiaCubaCyprusCzech RepublicDjiboutiDominicaDominican RepublicEast Asia & PacificEast Asia & Pacific (excluding high income)East Asia & Pacific (IDA & IBRD countries)EcuadorEgypt, Arab Rep.El SalvadorEquatorial GuineaEritreaEstoniaEthiopiaEuro areaEurope & Central AsiaEurope & Central Asia (excluding high income)Europe & Central Asia (IDA & IBRD countries)European UnionFijiFragile and conflict affected situationsFrench PolynesiaGabonGambia, TheGeorgiaGhanaGibraltarGrenadaGuatemalaGuineaGuinea-BissauGuyanaHaitiHeavily indebted poor countries (HIPC)High incomeHondurasHong Kong SAR, ChinaHungaryIBRD onlyIDA & IBRD totalIDA blendIDA onlyIDA totalIndiaIndonesiaIran, Islamic Rep.IraqIsraelJamaicaJordanKazakhstanKenyaKiribatiKorea, Dem. People’s Rep.Korea, Rep.KosovoKuwaitKyrgyz RepublicLao PDRLatin America & Caribbean Latin America & Caribbean (excluding high income)Latin America & the Caribbean (IDA & IBRD countries)LatviaLeast developed countries: UN classificationLebanonLesothoLiberiaLibyaLithuaniaLow & middle incomeLow incomeLower middle incomeMacao SAR, ChinaMacedonia, FYRMadagascarMalawiMalaysiaMaldivesMaliMaltaMarshall IslandsMauritaniaMauritiusMexicoMicronesia, Fed. Sts.Middle East & North AfricaMiddle East & North Africa (excluding high income)Middle East & North Africa (IDA & IBRD countries)Middle incomeMoldovaMongoliaMontenegroMoroccoMozambiqueMyanmarNamibiaNauruNepalNicaraguaNigerNigeriaNorth AmericaNorthern Mariana IslandsOECD membersOmanOther small statesPacific island small statesPakistanPalauPanamaPapua New GuineaParaguayPeruPhilippinesPolandQatarRomaniaRussian FederationRwandaSamoaSao Tome and PrincipeSaudi ArabiaSenegalSerbiaSeychellesSierra LeoneSingaporeSlovak RepublicSloveniaSmall statesSolomon IslandsSomaliaSouth AfricaSouth AsiaSouth Asia (IDA & IBRD)South SudanSri LankaSt. Kitts and NevisSt. LuciaSt. Vincent and the GrenadinesSub-Saharan Africa Sub-Saharan Africa (excluding high income)Sub-Saharan Africa (IDA & IBRD countries)SudanSurinameSwazilandSyrian Arab RepublicTajikistanTanzaniaThailandTimor-LesteTogoTongaTrinidad and TobagoTunisiaTurkeyTurkmenistanTuvaluUgandaUkraineUnited Arab EmiratesUpper middle incomeUruguayUzbekistanVanuatuVenezuela, RBVietnamWest Bank and GazaWorldYemen, Rep.ZambiaZimbabwe La ligne de temps
Cette échelle de temps montre un graphique de 1961 année à 2015 année IDA & IBRD total. Les données jusqu'à 1960 année ne sont pas présentés. Quantité d'observations actuelles selon dates: 55.
Source (désignation):
Les indicateurs du développement mondiale
Source (organisation):
Development Assistance Committee of the Organisation for Economic Co-operation and Development, Geographical Distribution of Financial Flows to Developing Countries, Development Co-operation Report, and International Development Statistics database. Data are available online at: www.oecd.org/dac/stats/idsonline.
Catégories:
Aid Effectiveness
Dernière mise à jour
23 avr. 2017
Les indicateurs de changement de valeurs selon les années
Minimum:
142.62 mln.
1 janv. 1961
Maximum:
7.953 mds
1 janv. 1996
Pour la date d''observation
Valeur
Changement absolu
Le changement par rapport à la valeur précédente
1 janv. 1961
142.62 mln.
+142.62 mln.
0.0%
1 janv. 1962
203.32 mln.
+60.7 mln.
42.56%
1 janv. 1963
223.27 mln.
+19.95 mln.
9.81%
1 janv. 1964
254.67 mln.
+31.4 mln.
14.06%
1 janv. 1965
265.35 mln.
+10.68 mln.
4.19%
1 janv. 1966
307.07 mln.
+41.72 mln.
15.72%
1 janv. 1967
275.28 mln.
-31.79 mln.
-10.35%
1 janv. 1968
328.97 mln.
+53.69 mln.
19.5%
1 janv. 1969
351.11 mln.
+22.14 mln.
6.73%
1 janv. 1970
361.39 mln.
+10.28 mln.
2.93%
1 janv. 1971
398.36 mln.
+36.97 mln.
10.23%
1 janv. 1972
446.86 mln.
+48.5 mln.
12.17%
1 janv. 1973
508.75 mln.
+61.89 mln.
13.85%
1 janv. 1974
556.87 mln.
+48.12 mln.
9.46%
1 janv. 1975
784.93 mln.
+228.06 mln.
40.95%
1 janv. 1976
963.98 mln.
+179.05 mln.
22.81%
1 janv. 1977
870.52 mln.
-93.46 mln.
-9.7%
1 janv. 1978
839.25 mln.
-31.27 mln.
-3.59%
1 janv. 1979
1.361 mds
+522.08 mln.
62.21%
1 janv. 1980
1.931 mds
+569.83 mln.
41.86%
1 janv. 1981
1.923 mds
-8.45 mln.
-0.44%
1 janv. 1982
1.976 mds
+53.19 mln.
2.77%
1 janv. 1983
1.909 mds
-66.74 mln.
-3.38%
1 janv. 1984
1.762 mds
-147.53 mln.
-7.73%
1 janv. 1985
1.458 mds
-303.39 mln.
-17.22%
1 janv. 1986
1.629 mds
+170.51 mln.
11.69%
1 janv. 1987
2.112 mds
+483.23 mln.
29.67%
1 janv. 1988
2.543 mds
+431.01 mln.
20.41%
1 janv. 1989
2.675 mds
+131.59 mln.
5.17%
1 janv. 1990
2.652 mds
-22.19 mln.
-0.83%
1 janv. 1991
4.729 mds
+2.077 mds
78.3%
1 janv. 1992
5.051 mds
+321.32 mln.
6.79%
1 janv. 1993
6.589 mds
+1.538 mds
30.45%
1 janv. 1994
5.285 mds
-1.304 mds
-19.79%
1 janv. 1995
5.082 mds
-202.95 mln.
-3.84%
1 janv. 1996
7.953 mds
+2.871 mds
56.5%
1 janv. 1997
4.669 mds
-3.284 mds
-41.29%
1 janv. 1998
3.274 mds
-1.395 mds
-29.87%
1 janv. 1999
3.099 mds
-175.31 mln.
-5.35%
1 janv. 2000
2.865 mds
-233.48 mln.
-7.53%
1 janv. 2001
2.262 mds
-603.19 mln.
-21.05%
1 janv. 2002
2.38 mds
+117.71 mln.
5.2%
1 janv. 2003
2.799 mds
+419.51 mln.
17.63%
1 janv. 2004
3.647 mds
+847.76 mln.
30.28%
1 janv. 2005
3.35 mds
-297.59 mln.
-8.16%
1 janv. 2006
6.356 mds
+3.006 mds
89.75%
1 janv. 2007
5.54 mds
-816.17 mln.
-12.84%
1 janv. 2008
6.308 mds
+768.25 mln.
13.87%
1 janv. 2009
6.947 mds
+639.04 mln.
10.13%
1 janv. 2010
4.68 mds
-2.268 mds
-32.64%
1 janv. 2011
4.834 mds
+153.96 mln.
3.29%
1 janv. 2012
5.842 mds
+1.008 mds
20.86%
1 janv. 2013
5.471 mds
-370.49 mln.
-6.34%
1 janv. 2014
5.633 mds
+161.32 mln.
2.95%
1 janv. 2015
7.326 mds
+1.693 mds
30.06%
Classement des pays selon les statistiques actuelles par années


Commentaires: