29
/fr/
fr
AIzaSyAYiBZKx7MnpbEhh9jyipgxe19OcubqV5w
April 1, 2024
36437
IBRD only
IBD
false
2
1
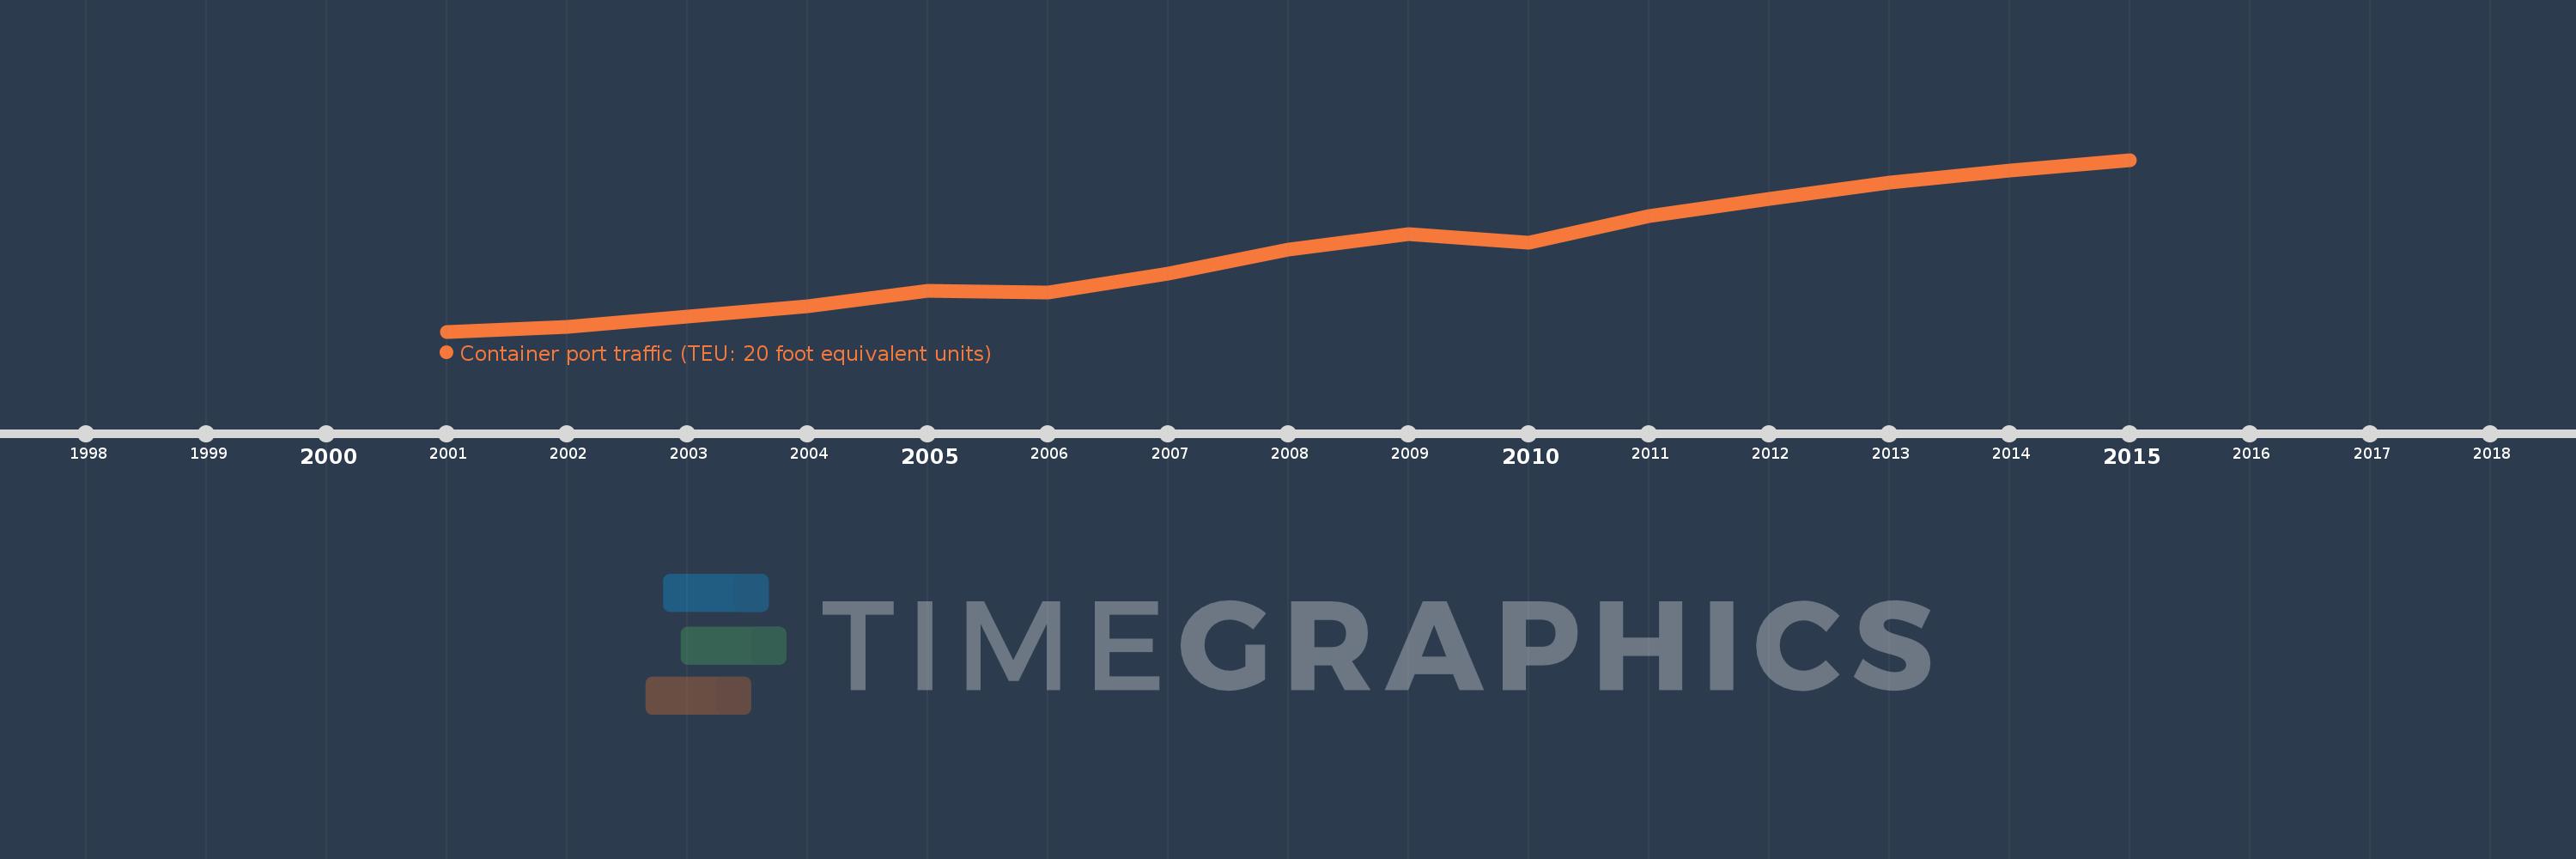
Container port traffic (TEU: 20 foot equivalent units)
2015,2014,2013,2012,2011,2010,2009,2008,2007,2006,2005,2004,2003,2002,2001
Cette statistique dans les autres pays:
La ligne de temps
Cette échelle de temps montre un graphique de 2001 année à 2015 année IBRD only. Les données jusqu'à 2000 année ne sont pas présentés. Quantité d'observations actuelles selon dates: 15.
Source (désignation):
Les indicateurs du développement mondiale
Source (organisation):
Containerisation International, Containerisation International Yearbook.
Catégories:
Infrastructure
Dernière mise à jour
23 avr. 2017
Les indicateurs de changement de valeurs selon les années
Minimum:
77.614 mln.
1 janv. 2001
Maximum:
326.702 mln.
1 janv. 2015
Pour la date d''observation
Valeur
Changement absolu
Le changement par rapport à la valeur précédente
1 janv. 2001
77.614 mln.
+77.614 mln.
0.0%
1 janv. 2002
84.465 mln.
+6.851 mln.
8.83%
1 janv. 2003
99.829 mln.
+15.364 mln.
18.19%
1 janv. 2004
114.936 mln.
+15.107 mln.
15.13%
1 janv. 2005
136.267 mln.
+21.331 mln.
18.56%
1 janv. 2006
134.893 mln.
-1.374 mln.
-1.01%
1 janv. 2007
161.621 mln.
+26.728 mln.
19.81%
1 janv. 2008
196.017 mln.
+34.396 mln.
21.28%
1 janv. 2009
219.422 mln.
+23.405 mln.
11.94%
1 janv. 2010
206.254 mln.
-13.168 mln.
-6.0%
1 janv. 2011
244.637 mln.
+38.383 mln.
18.61%
1 janv. 2012
270.481 mln.
+25.844 mln.
10.56%
1 janv. 2013
293.758 mln.
+23.277 mln.
8.61%
1 janv. 2014
311.578 mln.
+17.82 mln.
6.07%
1 janv. 2015
326.702 mln.
+15.124 mln.
4.85%
Classement des pays selon les statistiques actuelles par années


Commentaires: