29
/fr/
fr
AIzaSyAYiBZKx7MnpbEhh9jyipgxe19OcubqV5w
April 1, 2024
36392
IBRD only
IBD
false
2
1
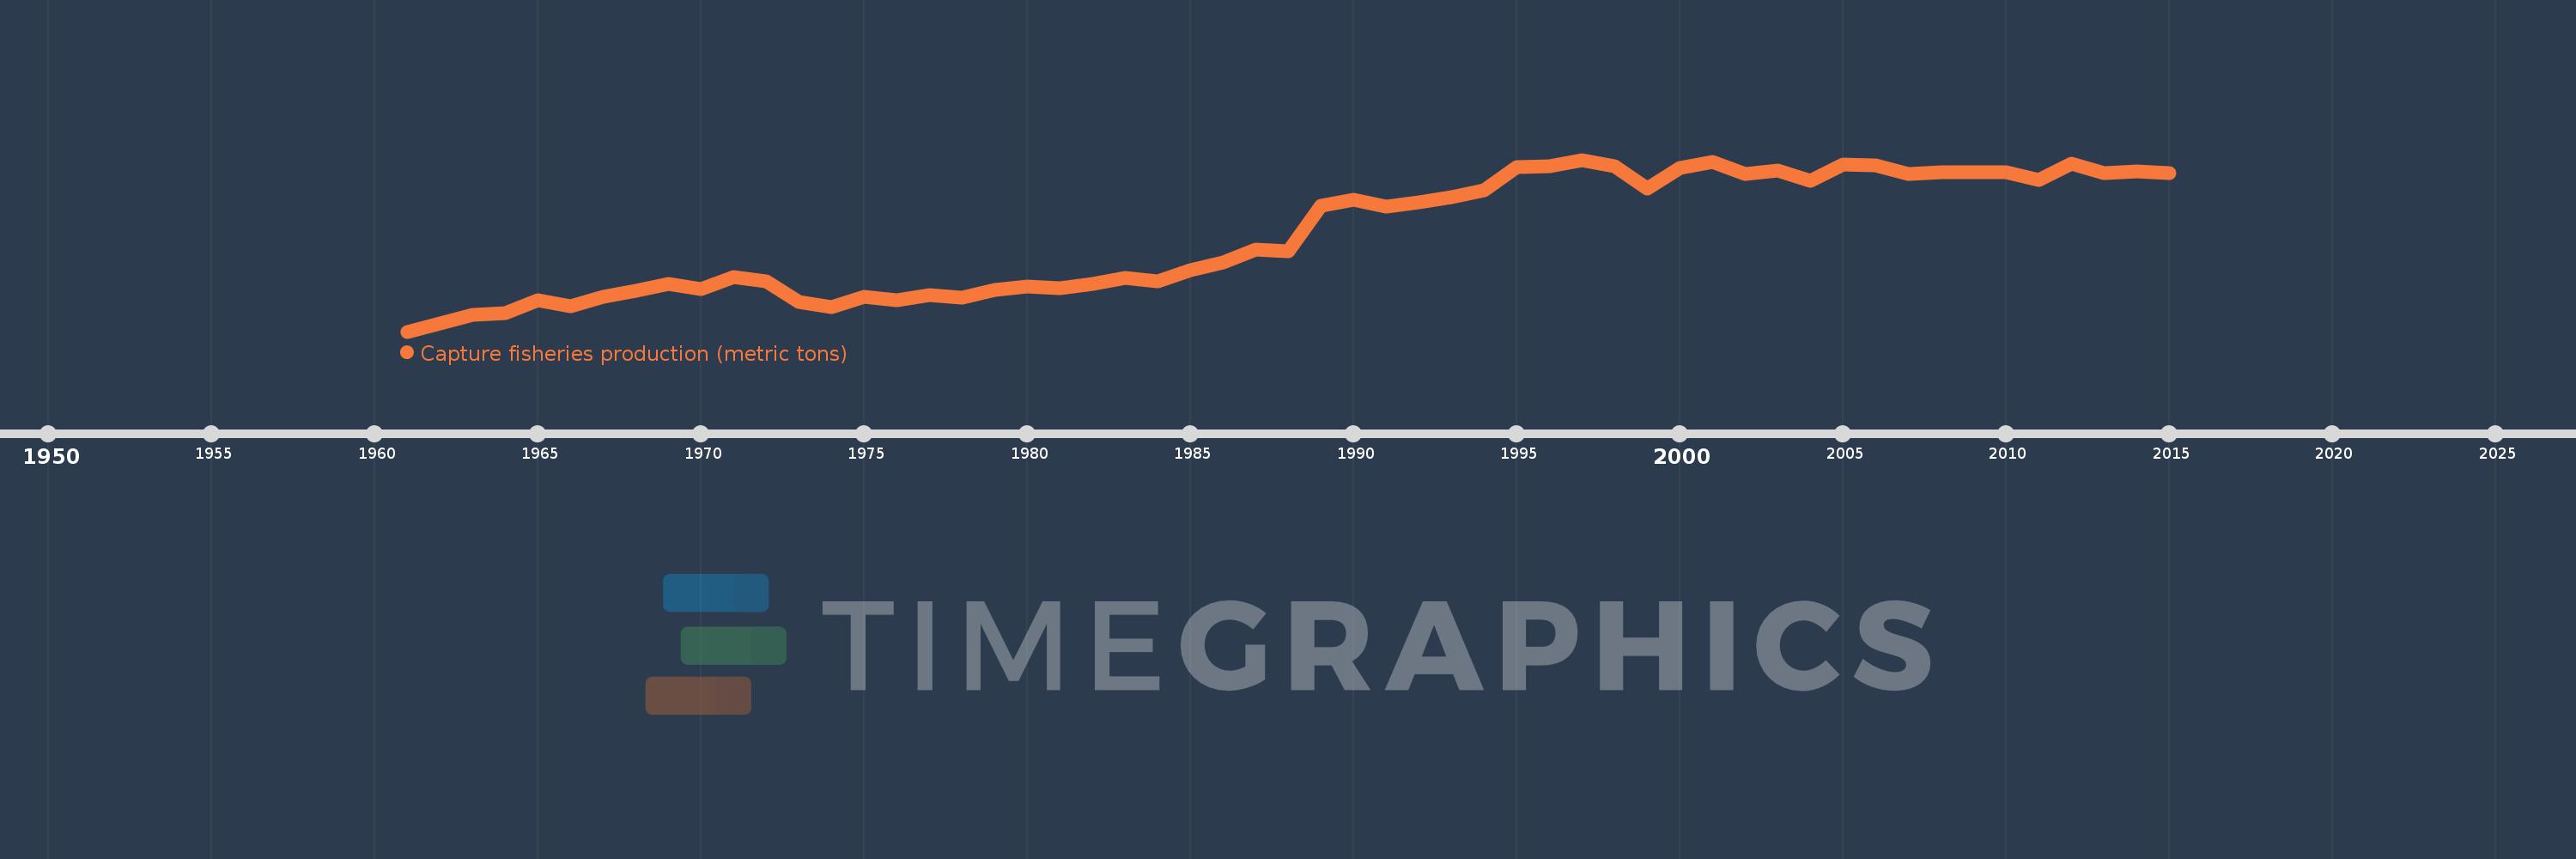
Capture fisheries production (metric tons)
2015,2014,2013,2012,2011,2010,2009,2008,2007,2006,2005,2004,2003,2002,2001,2000,1999,1998,1997,1996,1995,1994,1993,1992,1991,1990,1989,1988,1987,1986,1985,1984,1983,1982,1981,1980,1979,1978,1977,1976,1975,1974,1973,1972,1971,1970,1969,1968,1967,1966,1965,1964,1963,1962,1961
Cette statistique dans les autres pays:
AfghanistanAlbaniaAlgeriaAmerican SamoaAngolaAntigua and BarbudaArab WorldArgentinaArmeniaArubaAustraliaAustriaAzerbaijanBahamas, TheBahrainBangladeshBarbadosBelarusBelgiumBelizeBeninBermudaBhutanBoliviaBosnia and HerzegovinaBotswanaBrazilBritish Virgin IslandsBrunei DarussalamBulgariaBurkina FasoBurundiCabo VerdeCambodiaCameroonCanadaCaribbean small statesCayman IslandsCentral African RepublicCentral Europe and the BalticsChadChannel IslandsChileChinaColombiaComorosCongo, Dem. Rep.Congo, Rep.Costa RicaCote d'IvoireCroatiaCubaCuracaoCyprusCzech RepublicDenmarkDjiboutiDominicaDominican RepublicEarly-demographic dividendEast Asia & PacificEast Asia & Pacific (excluding high income)East Asia & Pacific (IDA & IBRD countries)EcuadorEgypt, Arab Rep.El SalvadorEquatorial GuineaEritreaEstoniaEthiopiaEuro areaEurope & Central AsiaEurope & Central Asia (excluding high income)Europe & Central Asia (IDA & IBRD countries)European UnionFaroe IslandsFijiFinlandFragile and conflict affected situationsFranceFrench PolynesiaGabonGambia, TheGeorgiaGermanyGhanaGreeceGreenlandGrenadaGuamGuatemalaGuineaGuinea-BissauGuyanaHaitiHeavily indebted poor countries (HIPC)High incomeHondurasHong Kong SAR, ChinaHungaryIBRD onlyIcelandIDA & IBRD totalIDA blendIDA onlyIDA totalIndiaIndonesiaIran, Islamic Rep.IraqIrelandIsle of ManIsraelItalyJamaicaJapanJordanKazakhstanKenyaKiribatiKorea, Dem. People’s Rep.Korea, Rep.KuwaitKyrgyz RepublicLao PDRLate-demographic dividendLatin America & Caribbean Latin America & Caribbean (excluding high income)Latin America & the Caribbean (IDA & IBRD countries)LatviaLeast developed countries: UN classificationLebanonLesothoLiberiaLibyaLithuaniaLow & middle incomeLow incomeLower middle incomeMacao SAR, ChinaMacedonia, FYRMadagascarMalawiMalaysiaMaldivesMaliMaltaMarshall IslandsMauritaniaMauritiusMexicoMicronesia, Fed. Sts.Middle East & North AfricaMiddle East & North Africa (excluding high income)Middle East & North Africa (IDA & IBRD countries)Middle incomeMoldovaMonacoMongoliaMontenegroMoroccoMozambiqueMyanmarNamibiaNauruNepalNetherlandsNew CaledoniaNew ZealandNicaraguaNigerNigeriaNorth AmericaNorthern Mariana IslandsNorwayOECD membersOmanOther small statesPacific island small statesPakistanPalauPanamaPapua New GuineaParaguayPeruPhilippinesPolandPortugalPost-demographic dividendPre-demographic dividendPuerto RicoQatarRomaniaRussian FederationRwandaSamoaSao Tome and PrincipeSaudi ArabiaSenegalSerbiaSeychellesSierra LeoneSingaporeSint Maarten (Dutch part)Slovak RepublicSloveniaSmall statesSolomon IslandsSomaliaSouth AfricaSouth AsiaSouth Asia (IDA & IBRD)South SudanSpainSri LankaSt. Kitts and NevisSt. LuciaSt. Martin (French part)St. Vincent and the GrenadinesSub-Saharan Africa Sub-Saharan Africa (excluding high income)Sub-Saharan Africa (IDA & IBRD countries)SudanSurinameSwazilandSwedenSwitzerlandSyrian Arab RepublicTajikistanTanzaniaThailandTimor-LesteTogoTongaTrinidad and TobagoTunisiaTurkeyTurkmenistanTurks and Caicos IslandsTuvaluUgandaUkraineUnited Arab EmiratesUnited KingdomUnited StatesUpper middle incomeUruguayUzbekistanVanuatuVenezuela, RBVietnamVirgin Islands (U.S.)West Bank and GazaWorldYemen, Rep.ZambiaZimbabwe La ligne de temps
Cette échelle de temps montre un graphique de 1961 année à 2015 année IBRD only. Les données jusqu'à 1960 année ne sont pas présentés. Quantité d'observations actuelles selon dates: 55.
Source (désignation):
Les indicateurs du développement mondiale
Source (organisation):
Food and Agriculture Organization.
Catégories:
Environment
Dernière mise à jour
23 avr. 2017
Les indicateurs de changement de valeurs selon les années
Minimum:
11.187 mln.
1 janv. 1961
Maximum:
58.018 mln.
1 janv. 1997
Pour la date d''observation
Valeur
Changement absolu
Le changement par rapport à la valeur précédente
1 janv. 1961
11.187 mln.
+11.187 mln.
0.0%
1 janv. 1962
13.435 mln.
+2.248 mln.
20.09%
1 janv. 1963
15.756 mln.
+2.321 mln.
17.28%
1 janv. 1964
16.213 mln.
+456.587 milles
2.9%
1 janv. 1965
19.704 mln.
+3.491 mln.
21.54%
1 janv. 1966
18.015 mln.
-1.689 mln.
-8.57%
1 janv. 1967
20.669 mln.
+2.654 mln.
14.73%
1 janv. 1968
22.36 mln.
+1.691 mln.
8.18%
1 janv. 1969
24.226 mln.
+1.867 mln.
8.35%
1 janv. 1970
22.682 mln.
-1.545 mln.
-6.38%
1 janv. 1971
26.143 mln.
+3.461 mln.
15.26%
1 janv. 1972
24.973 mln.
-1.169 mln.
-4.47%
1 janv. 1973
19.257 mln.
-5.717 mln.
-22.89%
1 janv. 1974
17.876 mln.
-1.38 mln.
-7.17%
1 janv. 1975
20.68 mln.
+2.804 mln.
15.68%
1 janv. 1976
19.847 mln.
-832.451 milles
-4.03%
1 janv. 1977
21.229 mln.
+1.381 mln.
6.96%
1 janv. 1978
20.441 mln.
-787.37 milles
-3.71%
1 janv. 1979
22.44 mln.
+1.999 mln.
9.78%
1 janv. 1980
23.38 mln.
+940.016 milles
4.19%
1 janv. 1981
22.982 mln.
-397.857 milles
-1.7%
1 janv. 1982
24.22 mln.
+1.238 mln.
5.39%
1 janv. 1983
25.84 mln.
+1.619 mln.
6.69%
1 janv. 1984
24.88 mln.
-959.259 milles
-3.71%
1 janv. 1985
27.881 mln.
+3.0 mln.
12.06%
1 janv. 1986
30.016 mln.
+2.135 mln.
7.66%
1 janv. 1987
33.516 mln.
+3.5 mln.
11.66%
1 janv. 1988
33.169 mln.
-346.197 milles
-1.03%
1 janv. 1989
45.481 mln.
+12.312 mln.
37.12%
1 janv. 1990
47.146 mln.
+1.665 mln.
3.66%
1 janv. 1991
45.245 mln.
-1.901 mln.
-4.03%
1 janv. 1992
46.318 mln.
+1.073 mln.
2.37%
1 janv. 1993
47.916 mln.
+1.598 mln.
3.45%
1 janv. 1994
49.599 mln.
+1.682 mln.
3.51%
1 janv. 1995
56.014 mln.
+6.415 mln.
12.93%
1 janv. 1996
56.21 mln.
+195.515 milles
0.35%
1 janv. 1997
58.018 mln.
+1.808 mln.
3.22%
1 janv. 1998
56.225 mln.
-1.793 mln.
-3.09%
1 janv. 1999
50.108 mln.
-6.117 mln.
-10.88%
1 janv. 2000
55.775 mln.
+5.667 mln.
11.31%
1 janv. 2001
57.526 mln.
+1.752 mln.
3.14%
1 janv. 2002
54.247 mln.
-3.279 mln.
-5.7%
1 janv. 2003
55.066 mln.
+818.968 milles
1.51%
1 janv. 2004
52.186 mln.
-2.88 mln.
-5.23%
1 janv. 2005
56.791 mln.
+4.605 mln.
8.82%
1 janv. 2006
56.414 mln.
-377.118 milles
-0.66%
1 janv. 2007
54.258 mln.
-2.156 mln.
-3.82%
1 janv. 2008
54.614 mln.
+355.333 milles
0.65%
1 janv. 2009
54.684 mln.
+69.997 milles
0.13%
1 janv. 2010
54.605 mln.
-78.723 milles
-0.14%
1 janv. 2011
52.524 mln.
-2.081 mln.
-3.81%
1 janv. 2012
56.91 mln.
+4.386 mln.
8.35%
1 janv. 2013
54.381 mln.
-2.53 mln.
-4.44%
1 janv. 2014
54.941 mln.
+560.723 milles
1.03%
1 janv. 2015
54.37 mln.
-571.299 milles
-1.04%
Classement des pays selon les statistiques actuelles par années


Commentaires: