29
/fr/
fr
AIzaSyAYiBZKx7MnpbEhh9jyipgxe19OcubqV5w
April 1, 2024
35867
High income
HIC
false
2
1
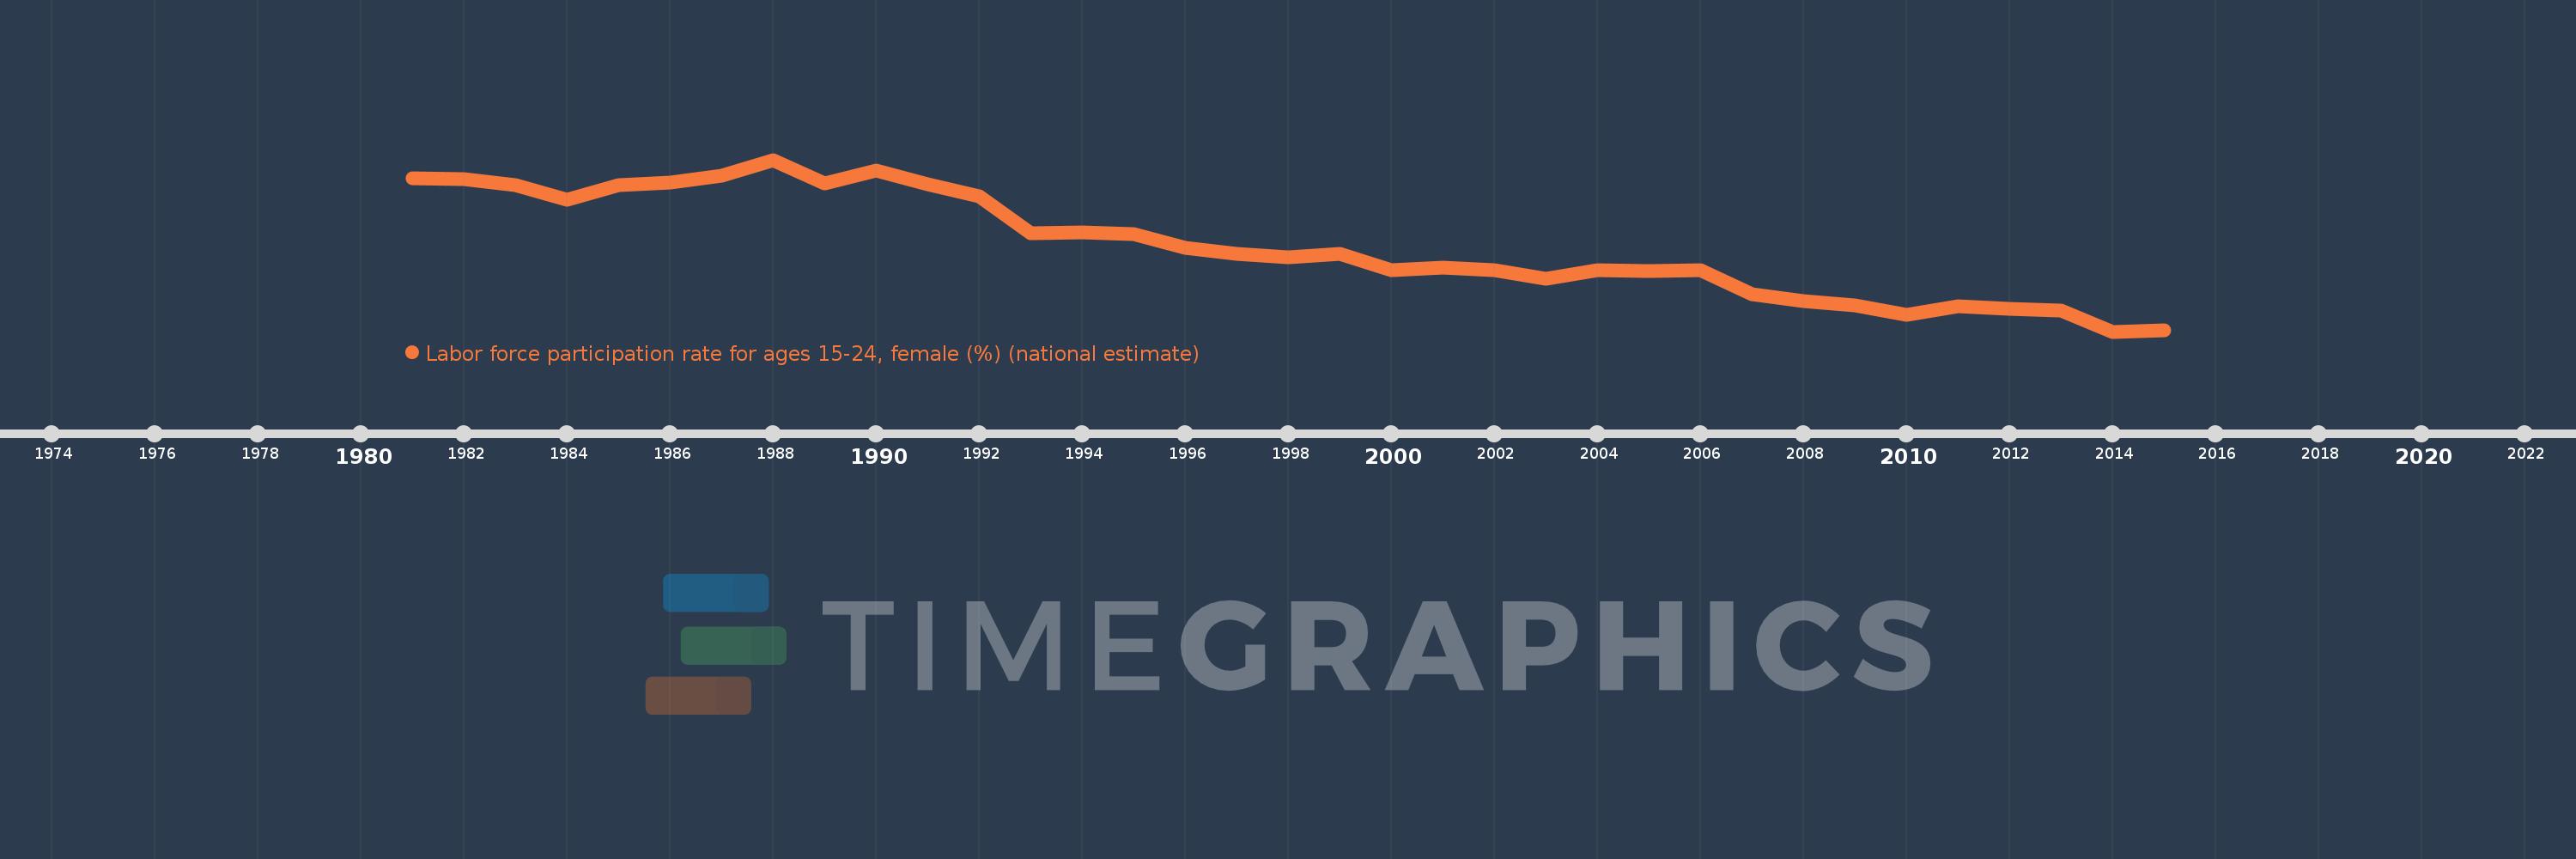
Labor force participation rate for ages 15-24, female (%) (national estimate)
2015,2014,2013,2012,2011,2010,2009,2008,2007,2006,2005,2004,2003,2002,2001,2000,1999,1998,1997,1996,1995,1994,1993,1992,1991,1990,1989,1988,1987,1986,1985,1984,1983,1982,1981
Cette statistique dans les autres pays:
AlbaniaAlgeriaAmerican SamoaAntigua and BarbudaArgentinaArmeniaArubaAustraliaAustriaAzerbaijanBahamas, TheBahrainBangladeshBarbadosBelarusBelgiumBelizeBeninBermudaBhutanBoliviaBosnia and HerzegovinaBotswanaBrazilBritish Virgin IslandsBrunei DarussalamBulgariaBurkina FasoBurundiCabo VerdeCambodiaCameroonCanadaCaribbean small statesCayman IslandsCentral African RepublicCentral Europe and the BalticsChadChileColombiaComorosCongo, Dem. Rep.Congo, Rep.Costa RicaCote d'IvoireCroatiaCubaCyprusCzech RepublicDenmarkDjiboutiDominicaDominican RepublicEarly-demographic dividendEcuadorEgypt, Arab Rep.El SalvadorEquatorial GuineaEstoniaEthiopiaEuro areaEurope & Central AsiaEurope & Central Asia (excluding high income)Europe & Central Asia (IDA & IBRD countries)European UnionFijiFinlandFranceFrench PolynesiaGabonGambia, TheGeorgiaGermanyGhanaGibraltarGreeceGrenadaGuamGuatemalaGuineaGuyanaHaitiHigh incomeHondurasHong Kong SAR, ChinaHungaryIcelandIDA blendIndiaIndonesiaIran, Islamic Rep.IraqIrelandIsle of ManIsraelItalyJamaicaJapanJordanKazakhstanKenyaKiribatiKorea, Rep.KosovoKuwaitKyrgyz RepublicLao PDRLatin America & Caribbean Latin America & Caribbean (excluding high income)Latin America & the Caribbean (IDA & IBRD countries)LatviaLebanonLesothoLiberiaLibyaLiechtensteinLithuaniaLower middle incomeLuxembourgMacao SAR, ChinaMacedonia, FYRMadagascarMalawiMalaysiaMaldivesMaliMaltaMauritiusMexicoMiddle East & North AfricaMiddle East & North Africa (excluding high income)Middle East & North Africa (IDA & IBRD countries)MoldovaMonacoMongoliaMontenegroMoroccoMozambiqueMyanmarNamibiaNauruNepalNetherlandsNew ZealandNicaraguaNigerNigeriaNorth AmericaNorthern Mariana IslandsNorwayOECD membersOmanPakistanPalauPanamaPapua New GuineaParaguayPeruPhilippinesPolandPortugalPost-demographic dividendPuerto RicoQatarRomaniaRussian FederationRwandaSamoaSan MarinoSao Tome and PrincipeSaudi ArabiaSenegalSerbiaSeychellesSierra LeoneSingaporeSlovak RepublicSloveniaSolomon IslandsSouth AfricaSouth AsiaSouth Asia (IDA & IBRD)South SudanSpainSri LankaSt. Kitts and NevisSt. LuciaSt. Vincent and the GrenadinesSudanSurinameSwazilandSwedenSwitzerlandSyrian Arab RepublicTajikistanTanzaniaThailandTimor-LesteTogoTongaTrinidad and TobagoTunisiaTurkeyTurks and Caicos IslandsUgandaUkraineUnited Arab EmiratesUnited KingdomUnited StatesUruguayVanuatuVenezuela, RBVietnamVirgin Islands (U.S.)West Bank and GazaYemen, Rep.ZambiaZimbabwe La ligne de temps
Cette échelle de temps montre un graphique de 1981 année à 2015 année High income. Les données jusqu'à 1980 année ne sont pas présentés. Quantité d'observations actuelles selon dates: 35.
Source (désignation):
Les indicateurs du développement mondiale
Source (organisation):
International Labour Organization, Key Indicators of the Labour Market database.
Catégories:
Social Protection & Labor
Dernière mise à jour
23 avr. 2017
Les indicateurs de changement de valeurs selon les années
Minimum:
44.707
1 janv. 2014
Maximum:
54.604
1 janv. 1988
Pour la date d''observation
Valeur
Changement absolu
Le changement par rapport à la valeur précédente
1 janv. 1981
53.529
+53.529
0.0%
1 janv. 1982
53.487
-0.041
-0.08%
1 janv. 1983
53.152
-0.335
-0.63%
1 janv. 1984
52.309
-0.843
-1.59%
1 janv. 1985
53.122
+0.813
1.55%
1 janv. 1986
53.273
+0.151
0.28%
1 janv. 1987
53.676
+0.403
0.76%
1 janv. 1988
54.604
+0.929
1.73%
1 janv. 1989
53.221
-1.384
-2.53%
1 janv. 1990
53.992
+0.771
1.45%
1 janv. 1991
53.186
-0.806
-1.49%
1 janv. 1992
52.52
-0.666
-1.25%
1 janv. 1993
50.367
-2.153
-4.1%
1 janv. 1994
50.403
+0.035
0.07%
1 janv. 1995
50.312
-0.09
-0.18%
1 janv. 1996
49.54
-0.772
-1.54%
1 janv. 1997
49.2
-0.34
-0.69%
1 janv. 1998
48.963
-0.237
-0.48%
1 janv. 1999
49.168
+0.205
0.42%
1 janv. 2000
48.238
-0.93
-1.89%
1 janv. 2001
48.409
+0.17
0.35%
1 janv. 2002
48.239
-0.169
-0.35%
1 janv. 2003
47.745
-0.494
-1.02%
1 janv. 2004
48.236
+0.491
1.03%
1 janv. 2005
48.199
-0.037
-0.08%
1 janv. 2006
48.261
+0.062
0.13%
1 janv. 2007
46.876
-1.385
-2.87%
1 janv. 2008
46.454
-0.422
-0.9%
1 janv. 2009
46.205
-0.249
-0.54%
1 janv. 2010
45.652
-0.554
-1.2%
1 janv. 2011
46.181
+0.53
1.16%
1 janv. 2012
46.001
-0.18
-0.39%
1 janv. 2013
45.904
-0.097
-0.21%
1 janv. 2014
44.707
-1.197
-2.61%
1 janv. 2015
44.789
+0.082
0.18%
Classement des pays selon les statistiques actuelles par années


Commentaires: