29
/fr/
fr
AIzaSyAYiBZKx7MnpbEhh9jyipgxe19OcubqV5w
April 1, 2024
35283
Heavily indebted poor countries (HIPC)
HPC
false
2
1
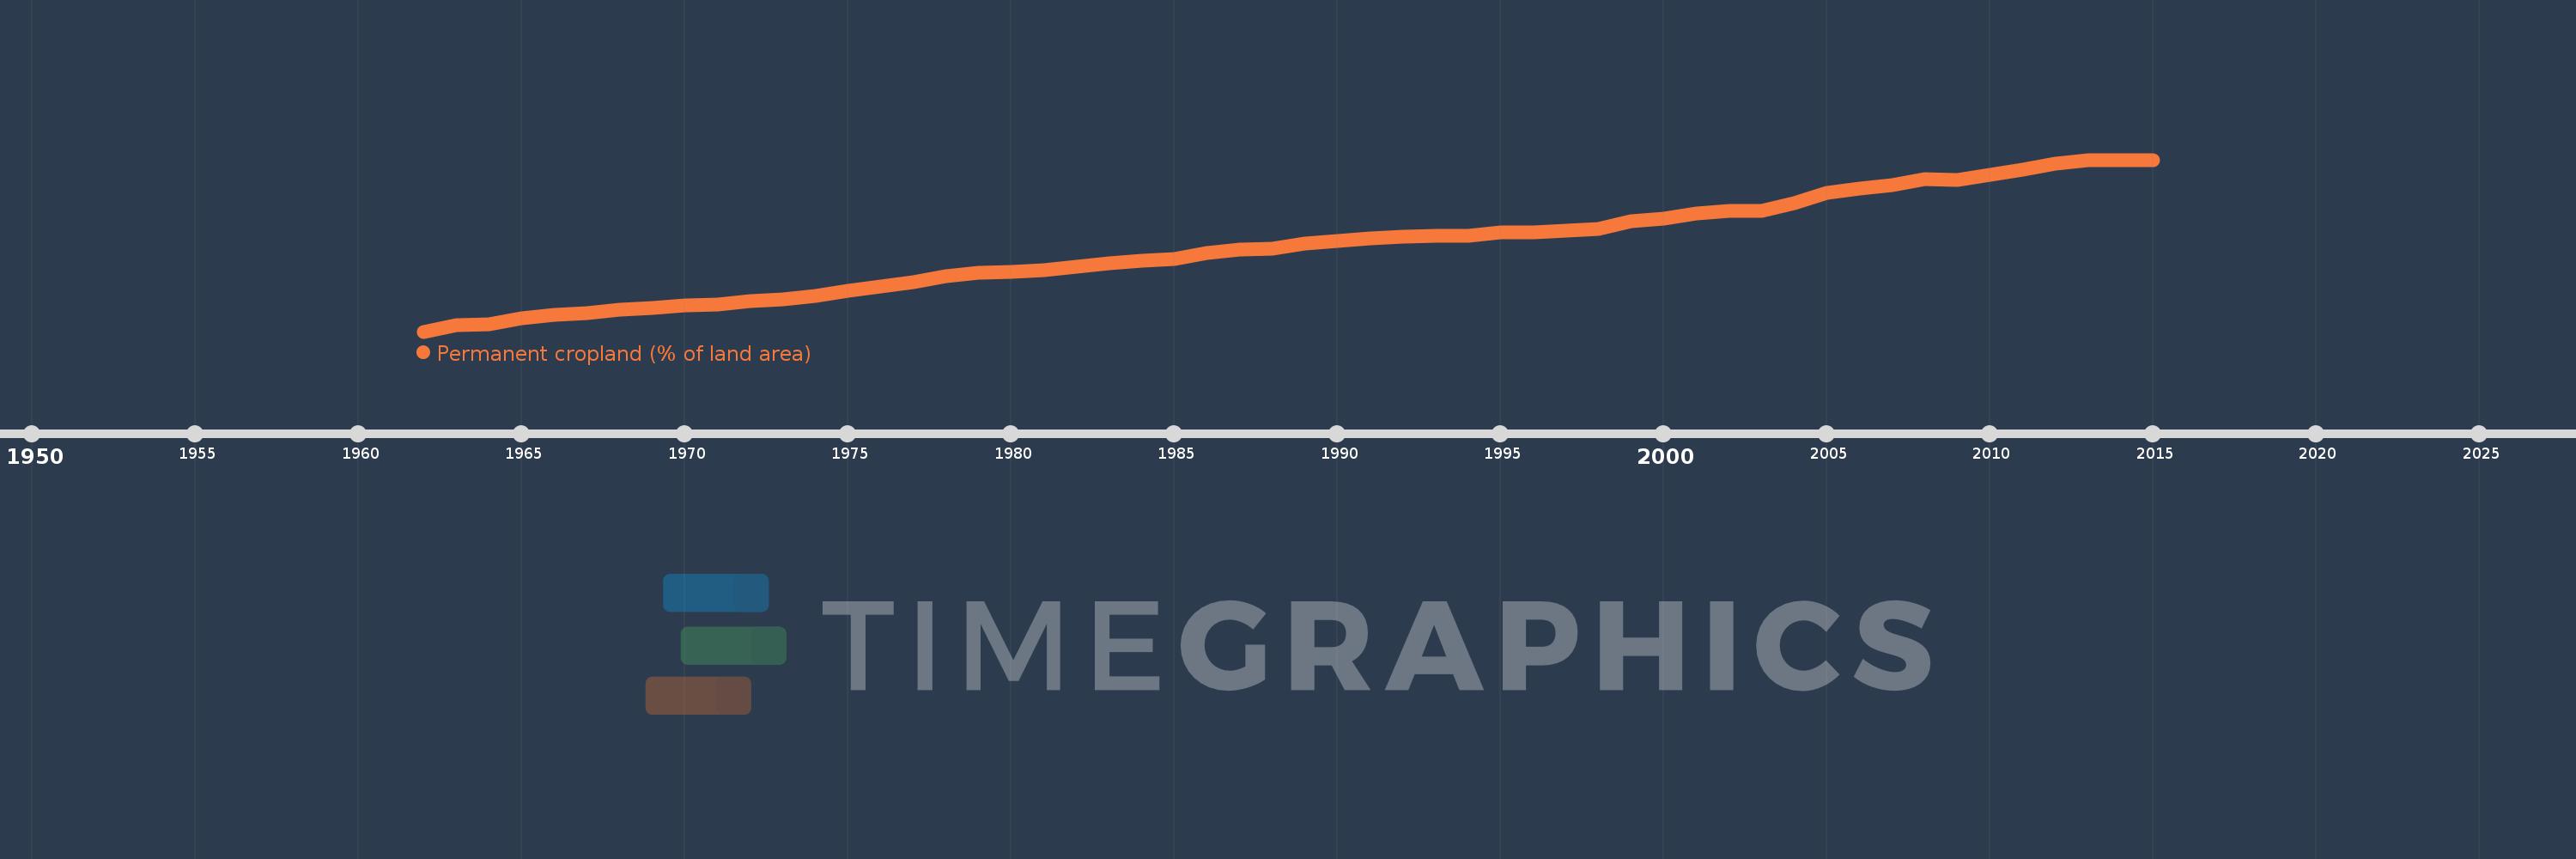
Permanent cropland (% of land area)
2015,2014,2013,2012,2011,2010,2009,2008,2007,2006,2005,2004,2003,2002,2001,2000,1999,1998,1997,1996,1995,1994,1993,1992,1991,1990,1989,1988,1987,1986,1985,1984,1983,1982,1981,1980,1979,1978,1977,1976,1975,1974,1973,1972,1971,1970,1969,1968,1967,1966,1965,1964,1963,1962
Cette statistique dans les autres pays:
AfghanistanAlbaniaAlgeriaAmerican SamoaAngolaAntigua and BarbudaArab WorldArgentinaArmeniaAustraliaAustriaAzerbaijanBahamas, TheBahrainBangladeshBarbadosBelarusBelgiumBelizeBeninBhutanBoliviaBosnia and HerzegovinaBotswanaBrazilBritish Virgin IslandsBrunei DarussalamBulgariaBurkina FasoBurundiCabo VerdeCambodiaCameroonCanadaCaribbean small statesCayman IslandsCentral African RepublicCentral Europe and the BalticsChadChileChinaColombiaComorosCongo, Dem. Rep.Congo, Rep.Costa RicaCote d'IvoireCroatiaCubaCyprusCzech RepublicDenmarkDominicaDominican RepublicEarly-demographic dividendEast Asia & PacificEast Asia & Pacific (excluding high income)East Asia & Pacific (IDA & IBRD countries)EcuadorEgypt, Arab Rep.El SalvadorEquatorial GuineaEritreaEstoniaEthiopiaEuro areaEurope & Central AsiaEurope & Central Asia (excluding high income)Europe & Central Asia (IDA & IBRD countries)European UnionFijiFinlandFragile and conflict affected situationsFranceFrench PolynesiaGabonGambia, TheGeorgiaGermanyGhanaGreeceGrenadaGuamGuatemalaGuineaGuinea-BissauGuyanaHaitiHeavily indebted poor countries (HIPC)High incomeHondurasHong Kong SAR, ChinaHungaryIBRD onlyIDA & IBRD totalIDA blendIDA onlyIDA totalIndiaIndonesiaIran, Islamic Rep.IraqIrelandIsraelItalyJamaicaJapanJordanKazakhstanKenyaKiribatiKorea, Dem. People’s Rep.Korea, Rep.KuwaitKyrgyz RepublicLao PDRLate-demographic dividendLatin America & Caribbean Latin America & Caribbean (excluding high income)Latin America & the Caribbean (IDA & IBRD countries)LatviaLeast developed countries: UN classificationLebanonLesothoLiberiaLibyaLithuaniaLow & middle incomeLow incomeLower middle incomeLuxembourgMacedonia, FYRMadagascarMalawiMalaysiaMaldivesMaliMaltaMarshall IslandsMauritaniaMauritiusMexicoMicronesia, Fed. Sts.Middle East & North AfricaMiddle East & North Africa (excluding high income)Middle East & North Africa (IDA & IBRD countries)Middle incomeMoldovaMongoliaMontenegroMoroccoMozambiqueMyanmarNamibiaNauruNepalNetherlandsNew CaledoniaNew ZealandNicaraguaNigerNigeriaNorth AmericaNorthern Mariana IslandsNorwayOECD membersOmanOther small statesPacific island small statesPakistanPalauPanamaPapua New GuineaParaguayPeruPhilippinesPolandPortugalPost-demographic dividendPre-demographic dividendPuerto RicoQatarRomaniaRussian FederationRwandaSamoaSao Tome and PrincipeSaudi ArabiaSenegalSerbiaSeychellesSierra LeoneSingaporeSlovak RepublicSloveniaSmall statesSolomon IslandsSomaliaSouth AfricaSouth AsiaSouth Asia (IDA & IBRD)SpainSri LankaSt. Kitts and NevisSt. LuciaSt. Vincent and the GrenadinesSub-Saharan Africa Sub-Saharan Africa (excluding high income)Sub-Saharan Africa (IDA & IBRD countries)SudanSurinameSwazilandSwedenSwitzerlandSyrian Arab RepublicTajikistanTanzaniaThailandTimor-LesteTogoTongaTrinidad and TobagoTunisiaTurkeyTurkmenistanTuvaluUgandaUkraineUnited Arab EmiratesUnited KingdomUnited StatesUpper middle incomeUruguayUzbekistanVanuatuVenezuela, RBVietnamVirgin Islands (U.S.)West Bank and GazaWorldYemen, Rep.ZambiaZimbabwe La ligne de temps
Cette échelle de temps montre un graphique de 1962 année à 2015 année Heavily indebted poor countries (HIPC). Les données jusqu'à 1961 année ne sont pas présentés. Quantité d'observations actuelles selon dates: 54.
Source (désignation):
Les indicateurs du développement mondiale
Source (organisation):
Food and Agriculture Organization, electronic files and web site.
Catégories:
Agriculture & Rural Development
Dernière mise à jour
23 avr. 2017
Les indicateurs de changement de valeurs selon les années
Minimum:
0.437
1 janv. 1962
Maximum:
1.071
1 janv. 2015
Pour la date d''observation
Valeur
Changement absolu
Le changement par rapport à la valeur précédente
1 janv. 1962
0.437
+0.437
0.0%
1 janv. 1963
0.46
+0.023
5.37%
1 janv. 1964
0.465
+0.005
0.99%
1 janv. 1965
0.486
+0.021
4.51%
1 janv. 1966
0.498
+0.012
2.54%
1 janv. 1967
0.505
+0.007
1.35%
1 janv. 1968
0.518
+0.013
2.53%
1 janv. 1969
0.525
+0.007
1.43%
1 janv. 1970
0.533
+0.008
1.44%
1 janv. 1971
0.538
+0.006
1.07%
1 janv. 1972
0.548
+0.01
1.88%
1 janv. 1973
0.555
+0.007
1.28%
1 janv. 1974
0.57
+0.014
2.56%
1 janv. 1975
0.586
+0.016
2.79%
1 janv. 1976
0.603
+0.018
3.03%
1 janv. 1977
0.618
+0.014
2.38%
1 janv. 1978
0.642
+0.025
3.99%
1 janv. 1979
0.654
+0.011
1.75%
1 janv. 1980
0.656
+0.003
0.4%
1 janv. 1981
0.664
+0.008
1.22%
1 janv. 1982
0.677
+0.013
1.97%
1 janv. 1983
0.69
+0.013
1.85%
1 janv. 1984
0.7
+0.01
1.48%
1 janv. 1985
0.706
+0.006
0.8%
1 janv. 1986
0.726
+0.021
2.93%
1 janv. 1987
0.739
+0.012
1.7%
1 janv. 1988
0.742
+0.004
0.49%
1 janv. 1989
0.761
+0.018
2.49%
1 janv. 1990
0.771
+0.01
1.33%
1 janv. 1991
0.78
+0.01
1.24%
1 janv. 1992
0.786
+0.006
0.71%
1 janv. 1993
0.791
+0.005
0.66%
1 janv. 1994
0.791
0.0
-0.05%
1 janv. 1995
0.802
+0.011
1.42%
1 janv. 1996
0.802
+0.0
0.01%
1 janv. 1997
0.81
+0.008
1.04%
1 janv. 1998
0.817
+0.007
0.85%
1 janv. 1999
0.843
+0.026
3.21%
1 janv. 2000
0.854
+0.011
1.29%
1 janv. 2001
0.872
+0.017
2.04%
1 janv. 2002
0.881
+0.009
1.08%
1 janv. 2003
0.883
+0.002
0.19%
1 janv. 2004
0.91
+0.028
3.14%
1 janv. 2005
0.949
+0.039
4.28%
1 janv. 2006
0.964
+0.015
1.58%
1 janv. 2007
0.977
+0.013
1.35%
1 janv. 2008
1.001
+0.023
2.37%
1 janv. 2009
0.998
-0.002
-0.24%
1 janv. 2010
1.015
+0.017
1.68%
1 janv. 2011
1.034
+0.019
1.88%
1 janv. 2012
1.058
+0.024
2.29%
1 janv. 2013
1.069
+0.011
1.02%
1 janv. 2014
1.07
+0.001
0.12%
1 janv. 2015
1.071
+0.001
0.11%
Classement des pays selon les statistiques actuelles par années


Commentaires: