29
/fr/
fr
AIzaSyAYiBZKx7MnpbEhh9jyipgxe19OcubqV5w
April 1, 2024
35282
Heavily indebted poor countries (HIPC)
HPC
false
2
1
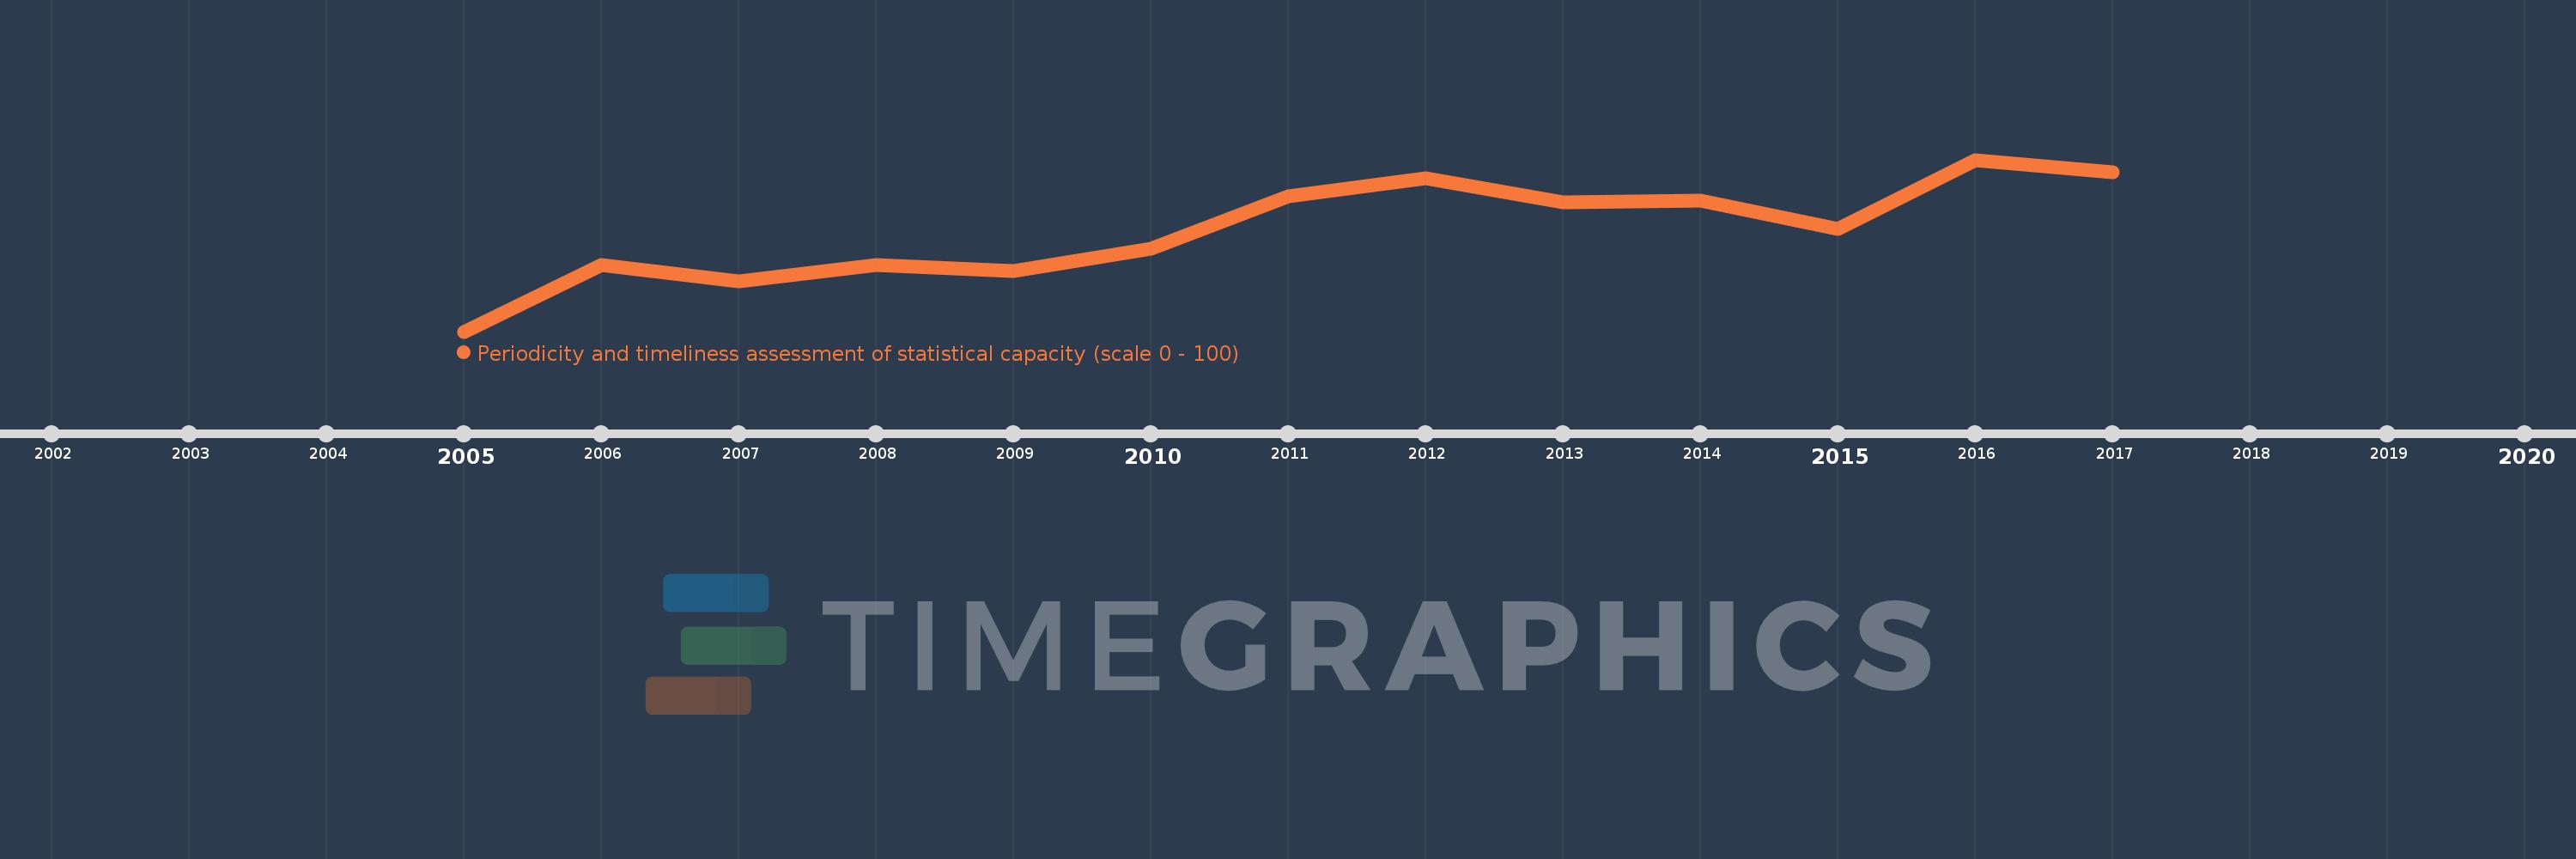
Periodicity and timeliness assessment of statistical capacity (scale 0 - 100)
2017,2016,2015,2014,2013,2012,2011,2010,2009,2008,2007,2006,2005
Cette statistique dans les autres pays:
La ligne de temps
Cette échelle de temps montre un graphique de 2005 année à 2017 année Heavily indebted poor countries (HIPC). Les données jusqu'à 2004 année ne sont pas présentés. Quantité d'observations actuelles selon dates: 13.
Source (désignation):
Les indicateurs du développement mondiale
Source (organisation):
World Bank
Catégories:
Public Sector
Dernière mise à jour
23 avr. 2017
Les indicateurs de changement de valeurs selon les années
Minimum:
75.556
1 janv. 2005
Maximum:
83.426
1 janv. 2016
Pour la date d''observation
Valeur
Changement absolu
Le changement par rapport à la valeur précédente
1 janv. 2005
75.556
+75.556
0.0%
1 janv. 2006
78.611
+3.056
4.04%
1 janv. 2007
77.87
-0.741
-0.94%
1 janv. 2008
78.611
+0.741
0.95%
1 janv. 2009
78.333
-0.278
-0.35%
1 janv. 2010
79.352
+1.019
1.3%
1 janv. 2011
81.759
+2.407
3.03%
1 janv. 2012
82.593
+0.833
1.02%
1 janv. 2013
81.481
-1.111
-1.35%
1 janv. 2014
81.574
+0.093
0.11%
1 janv. 2015
80.278
-1.296
-1.59%
1 janv. 2016
83.426
+3.148
3.92%
1 janv. 2017
82.87
-0.556
-0.67%
Classement des pays selon les statistiques actuelles par années


Commentaires: