29
/fr/
fr
AIzaSyAYiBZKx7MnpbEhh9jyipgxe19OcubqV5w
April 1, 2024
34382
Fragile and conflict affected situations
FCS
false
2
1
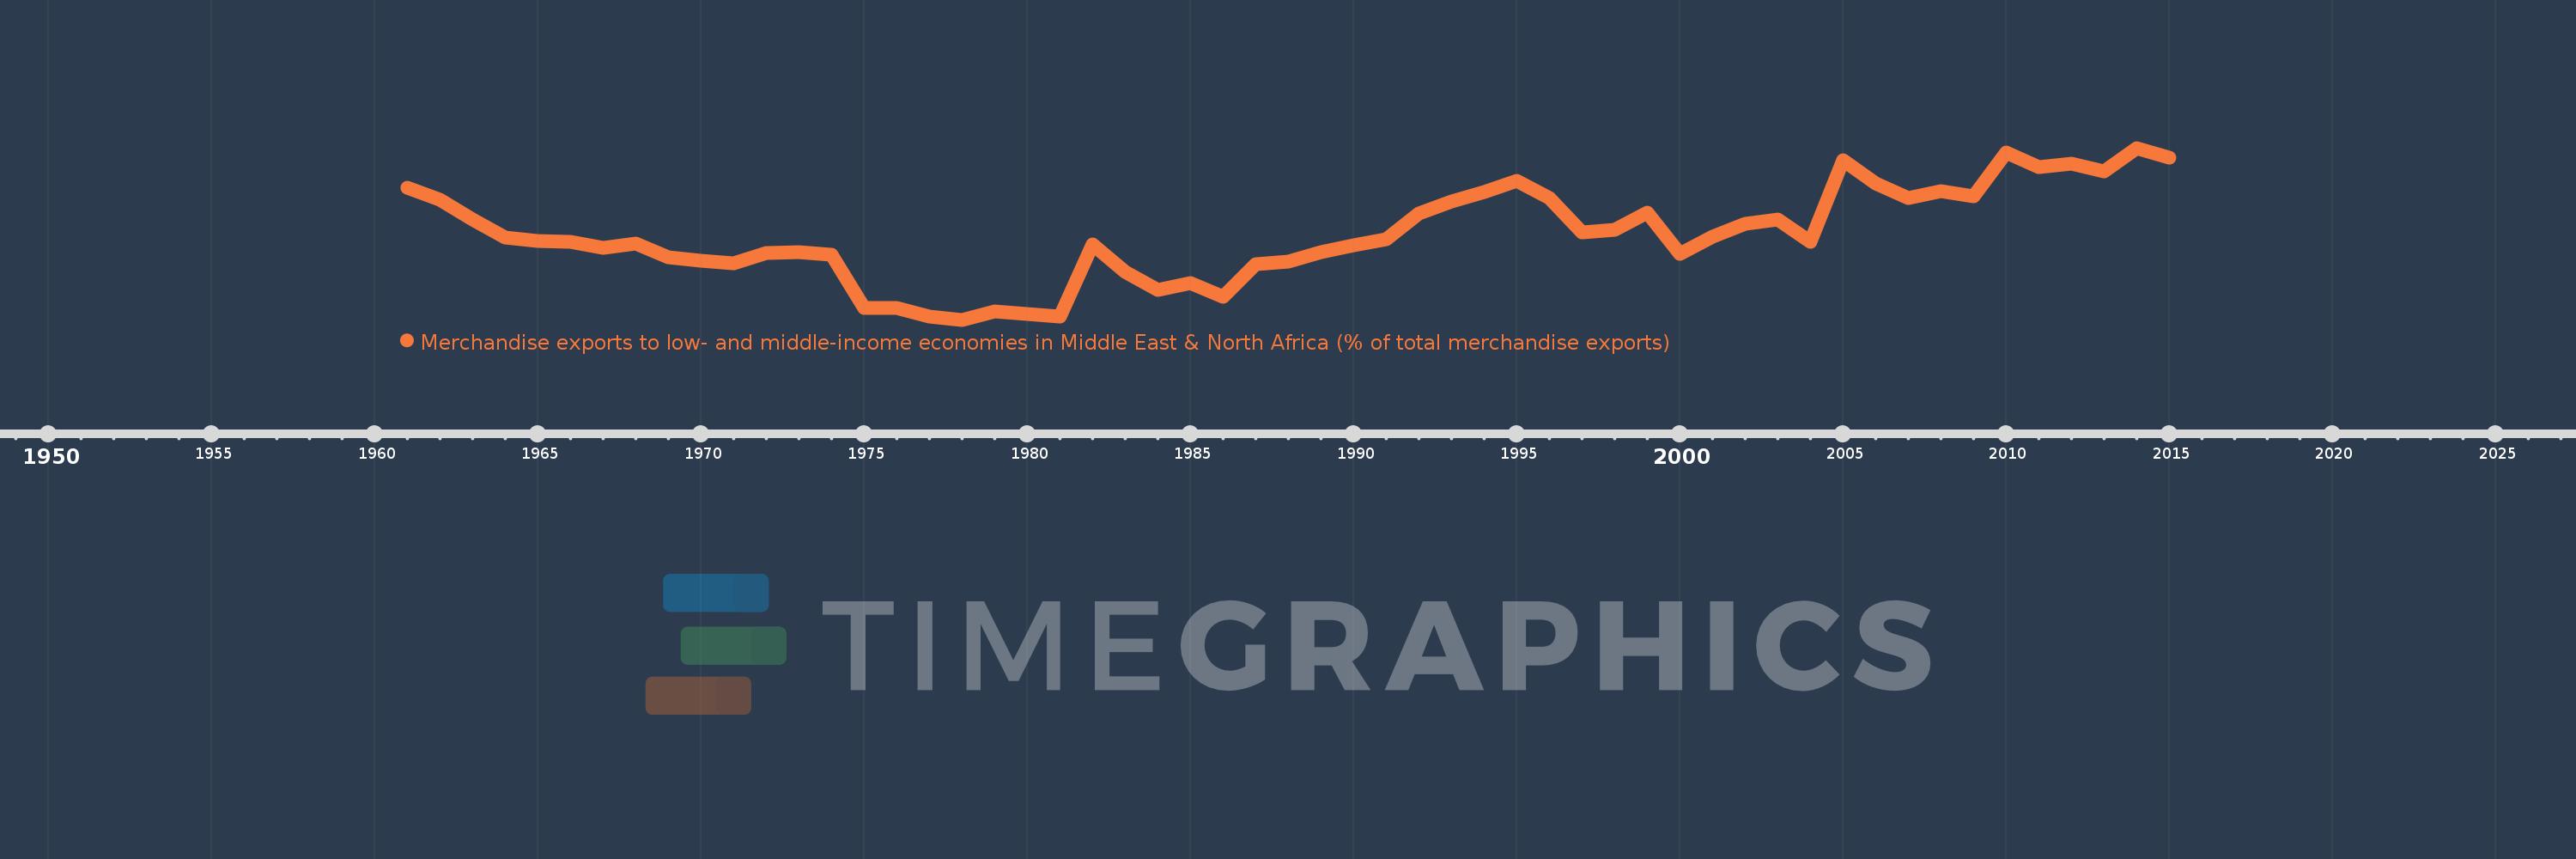
Merchandise exports to low- and middle-income economies in Middle East & North Africa (% of total merchandise exports)
2015,2014,2013,2012,2011,2010,2009,2008,2007,2006,2005,2004,2003,2002,2001,2000,1999,1998,1997,1996,1995,1994,1993,1992,1991,1990,1989,1988,1987,1986,1985,1984,1983,1982,1981,1980,1979,1978,1977,1976,1975,1974,1973,1972,1971,1970,1969,1968,1967,1966,1965,1964,1963,1962,1961
Cette statistique dans les autres pays:
AfghanistanAlbaniaAlgeriaAngolaArab WorldArgentinaArmeniaArubaAustraliaAustriaAzerbaijanBahamas, TheBahrainBangladeshBarbadosBelarusBelgiumBelizeBeninBermudaBoliviaBosnia and HerzegovinaBrazilBrunei DarussalamBulgariaBurkina FasoBurundiCabo VerdeCambodiaCameroonCanadaCaribbean small statesCentral African RepublicCentral Europe and the BalticsChadChileChinaColombiaComorosCongo, Dem. Rep.Congo, Rep.Costa RicaCote d'IvoireCroatiaCubaCyprusCzech RepublicDenmarkDjiboutiDominicaDominican RepublicEarly-demographic dividendEast Asia & PacificEast Asia & Pacific (excluding high income)East Asia & Pacific (IDA & IBRD countries)EcuadorEgypt, Arab Rep.El SalvadorEquatorial GuineaEstoniaEthiopiaEuro areaEurope & Central AsiaEurope & Central Asia (excluding high income)Europe & Central Asia (IDA & IBRD countries)European UnionFijiFinlandFragile and conflict affected situationsFranceGabonGambia, TheGeorgiaGermanyGhanaGreeceGreenlandGrenadaGuatemalaGuineaGuinea-BissauGuyanaHaitiHeavily indebted poor countries (HIPC)High incomeHondurasHong Kong SAR, ChinaHungaryIBRD onlyIcelandIDA & IBRD totalIDA blendIDA onlyIDA totalIndiaIndonesiaIran, Islamic Rep.IraqIrelandIsraelItalyJamaicaJapanJordanKazakhstanKenyaKorea, Dem. People’s Rep.Korea, Rep.KosovoKuwaitKyrgyz RepublicLao PDRLate-demographic dividendLatin America & Caribbean Latin America & Caribbean (excluding high income)Latin America & the Caribbean (IDA & IBRD countries)LatviaLeast developed countries: UN classificationLebanonLiberiaLibyaLithuaniaLow & middle incomeLow incomeLower middle incomeLuxembourgMacao SAR, ChinaMacedonia, FYRMadagascarMalawiMalaysiaMaliMaltaMauritaniaMauritiusMexicoMiddle East & North AfricaMiddle East & North Africa (excluding high income)Middle East & North Africa (IDA & IBRD countries)Middle incomeMoldovaMongoliaMontenegroMoroccoMozambiqueMyanmarNepalNetherlandsNew CaledoniaNew ZealandNicaraguaNigerNigeriaNorth AmericaNorwayOECD membersOmanOther small statesPacific island small statesPakistanPanamaPapua New GuineaParaguayPeruPhilippinesPolandPortugalPost-demographic dividendPre-demographic dividendQatarRomaniaRussian FederationRwandaSamoaSaudi ArabiaSenegalSerbiaSeychellesSierra LeoneSingaporeSlovak RepublicSloveniaSmall statesSomaliaSouth AfricaSouth AsiaSouth Asia (IDA & IBRD)SpainSri LankaSt. LuciaSub-Saharan Africa Sub-Saharan Africa (excluding high income)Sub-Saharan Africa (IDA & IBRD countries)SudanSurinameSwedenSwitzerlandSyrian Arab RepublicTajikistanTanzaniaThailandTogoTrinidad and TobagoTunisiaTurkeyTurkmenistanUgandaUkraineUnited Arab EmiratesUnited KingdomUnited StatesUpper middle incomeUruguayUzbekistanVenezuela, RBVietnamWorldYemen, Rep.ZambiaZimbabwe La ligne de temps
Cette échelle de temps montre un graphique de 1961 année à 2015 année Fragile and conflict affected situations. Les données jusqu'à 1960 année ne sont pas présentés. Quantité d'observations actuelles selon dates: 55.
Source (désignation):
Les indicateurs du développement mondiale
Source (organisation):
World Bank staff estimates based data from International Monetary Fund's Direction of Trade database.
Catégories:
Private Sector, Trade
Dernière mise à jour
23 avr. 2017
Les indicateurs de changement de valeurs selon les années
Minimum:
0.938
1 janv. 1978
Maximum:
7.865
1 janv. 2014
Pour la date d''observation
Valeur
Changement absolu
Le changement par rapport à la valeur précédente
1 janv. 1961
6.274
+6.274
0.0%
1 janv. 1962
5.786
-0.489
-7.79%
1 janv. 1963
4.967
-0.818
-14.14%
1 janv. 1964
4.266
-0.701
-14.12%
1 janv. 1965
4.118
-0.148
-3.47%
1 janv. 1966
4.096
-0.022
-0.52%
1 janv. 1967
3.847
-0.249
-6.09%
1 janv. 1968
3.994
+0.147
3.81%
1 janv. 1969
3.466
-0.528
-13.21%
1 janv. 1970
3.315
-0.151
-4.36%
1 janv. 1971
3.217
-0.098
-2.94%
1 janv. 1972
3.612
+0.394
12.26%
1 janv. 1973
3.654
+0.042
1.17%
1 janv. 1974
3.544
-0.109
-2.99%
1 janv. 1975
1.4
-2.144
-60.5%
1 janv. 1976
1.425
+0.025
1.78%
1 janv. 1977
1.079
-0.346
-24.29%
1 janv. 1978
0.938
-0.141
-13.06%
1 janv. 1979
1.272
+0.334
35.63%
1 janv. 1980
1.162
-0.11
-8.64%
1 janv. 1981
1.07
-0.093
-7.98%
1 janv. 1982
3.971
+2.901
271.25%
1 janv. 1983
2.851
-1.12
-28.2%
1 janv. 1984
2.144
-0.707
-24.8%
1 janv. 1985
2.406
+0.262
12.24%
1 janv. 1986
1.852
-0.555
-23.05%
1 janv. 1987
3.165
+1.314
70.95%
1 janv. 1988
3.29
+0.124
3.93%
1 janv. 1989
3.653
+0.364
11.06%
1 janv. 1990
3.936
+0.282
7.72%
1 janv. 1991
4.19
+0.255
6.47%
1 janv. 1992
5.208
+1.018
24.3%
1 janv. 1993
5.714
+0.506
9.71%
1 janv. 1994
6.086
+0.372
6.52%
1 janv. 1995
6.522
+0.436
7.16%
1 janv. 1996
5.843
-0.68
-10.42%
1 janv. 1997
4.447
-1.396
-23.89%
1 janv. 1998
4.568
+0.122
2.74%
1 janv. 1999
5.272
+0.703
15.39%
1 janv. 2000
3.602
-1.67
-31.67%
1 janv. 2001
4.299
+0.697
19.35%
1 janv. 2002
4.821
+0.522
12.15%
1 janv. 2003
4.99
+0.169
3.51%
1 janv. 2004
4.09
-0.9
-18.03%
1 janv. 2005
7.385
+3.295
80.55%
1 janv. 2006
6.448
-0.937
-12.69%
1 janv. 2007
5.855
-0.593
-9.19%
1 janv. 2008
6.122
+0.267
4.57%
1 janv. 2009
5.909
-0.213
-3.48%
1 janv. 2010
7.668
+1.758
29.75%
1 janv. 2011
7.091
-0.577
-7.52%
1 janv. 2012
7.247
+0.156
2.2%
1 janv. 2013
6.936
-0.311
-4.3%
1 janv. 2014
7.865
+0.929
13.39%
1 janv. 2015
7.477
-0.387
-4.92%
Classement des pays selon les statistiques actuelles par années


Commentaires: