29
/fr/
fr
AIzaSyAYiBZKx7MnpbEhh9jyipgxe19OcubqV5w
April 1, 2024
34301
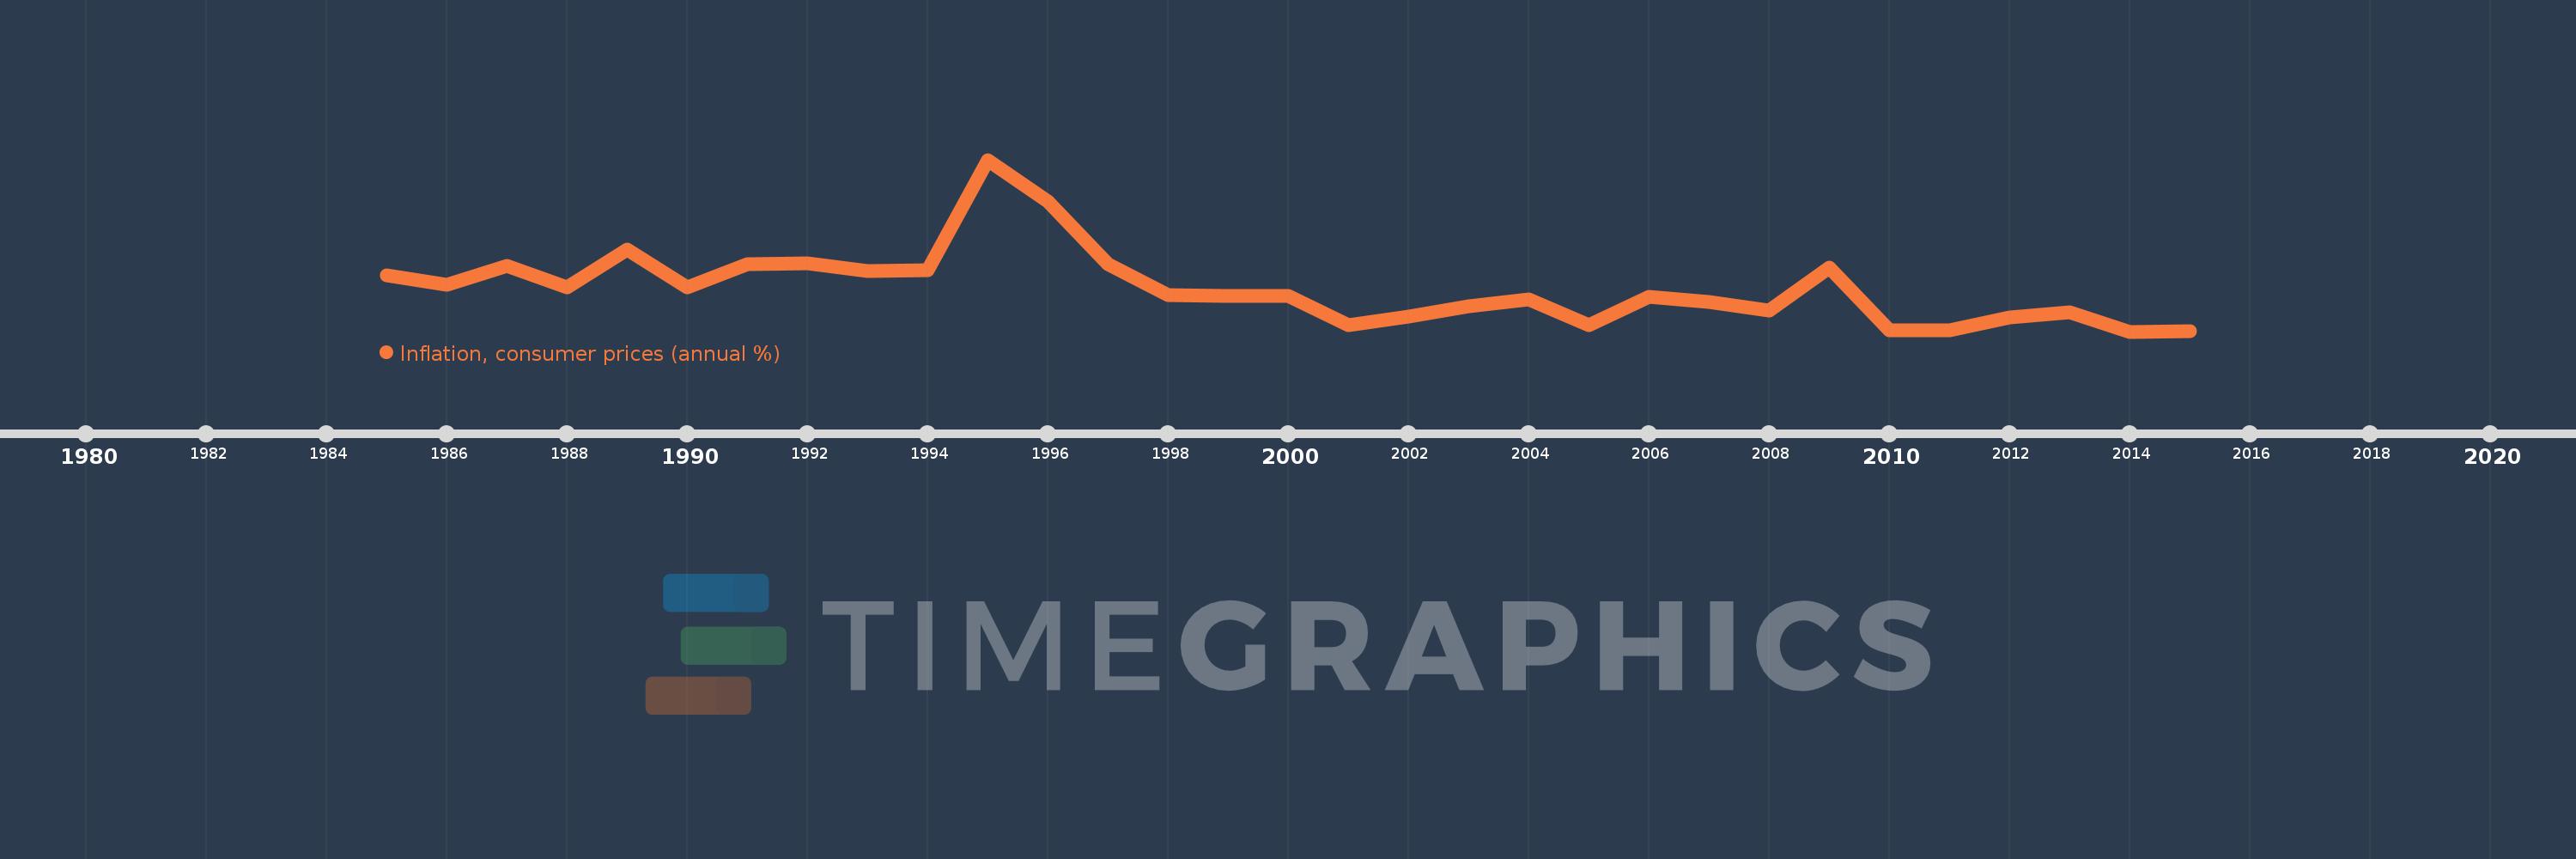
Fragile and conflict affected situations
FCS
false
2
1
Inflation, consumer prices (annual %)
2015,2014,2013,2012,2011,2010,2009,2008,2007,2006,2005,2004,2003,2002,2001,2000,1999,1998,1997,1996,1995,1994,1993,1992,1991,1990,1989,1988,1987,1986,1985
Cette statistique dans les autres pays:
AfghanistanAlbaniaAlgeriaAngolaAntigua and BarbudaArab WorldArgentinaArmeniaArubaAustraliaAustriaAzerbaijanBahamas, TheBahrainBangladeshBarbadosBelarusBelgiumBelizeBeninBhutanBoliviaBotswanaBrazilBrunei DarussalamBulgariaBurkina FasoBurundiCabo VerdeCambodiaCameroonCanadaCaribbean small statesCentral African RepublicCentral Europe and the BalticsChadChileChinaColombiaComorosCongo, Dem. Rep.Congo, Rep.Costa RicaCote d'IvoireCroatiaCyprusCzech RepublicDenmarkDjiboutiDominicaDominican RepublicEarly-demographic dividendEast Asia & PacificEast Asia & Pacific (excluding high income)East Asia & Pacific (IDA & IBRD countries)EcuadorEgypt, Arab Rep.El SalvadorEquatorial GuineaEstoniaEthiopiaEuro areaEurope & Central AsiaEurope & Central Asia (excluding high income)Europe & Central Asia (IDA & IBRD countries)European UnionFijiFinlandFragile and conflict affected situationsFranceGabonGambia, TheGeorgiaGermanyGhanaGreeceGrenadaGuatemalaGuineaGuinea-BissauGuyanaHaitiHeavily indebted poor countries (HIPC)High incomeHondurasHong Kong SAR, ChinaHungaryIBRD onlyIcelandIDA & IBRD totalIDA blendIDA onlyIDA totalIndiaIndonesiaIran, Islamic Rep.IraqIrelandIsraelItalyJamaicaJapanJordanKazakhstanKenyaKorea, Rep.KuwaitKyrgyz RepublicLao PDRLate-demographic dividendLatin America & Caribbean Latin America & Caribbean (excluding high income)Latin America & the Caribbean (IDA & IBRD countries)LatviaLeast developed countries: UN classificationLebanonLesothoLiberiaLibyaLithuaniaLow & middle incomeLow incomeLower middle incomeLuxembourgMacao SAR, ChinaMacedonia, FYRMadagascarMalawiMalaysiaMaldivesMaliMaltaMauritaniaMauritiusMexicoMiddle East & North AfricaMiddle East & North Africa (excluding high income)Middle East & North Africa (IDA & IBRD countries)Middle incomeMoldovaMongoliaMontenegroMoroccoMozambiqueMyanmarNamibiaNepalNetherlandsNew ZealandNicaraguaNigerNigeriaNorth AmericaNorwayOECD membersOmanOther small statesPakistanPanamaPapua New GuineaParaguayPeruPhilippinesPolandPortugalPost-demographic dividendPre-demographic dividendQatarRomaniaRussian FederationRwandaSamoaSao Tome and PrincipeSaudi ArabiaSenegalSerbiaSeychellesSierra LeoneSingaporeSlovak RepublicSloveniaSmall statesSolomon IslandsSouth AfricaSouth AsiaSouth Asia (IDA & IBRD)South SudanSpainSri LankaSt. Kitts and NevisSt. LuciaSt. Vincent and the GrenadinesSub-Saharan Africa Sub-Saharan Africa (excluding high income)Sub-Saharan Africa (IDA & IBRD countries)SudanSurinameSwazilandSwedenSwitzerlandSyrian Arab RepublicTajikistanTanzaniaThailandTimor-LesteTogoTongaTrinidad and TobagoTunisiaTurkeyUgandaUkraineUnited KingdomUnited StatesUpper middle incomeUruguayVanuatuVenezuela, RBVietnamWorldYemen, Rep.ZambiaZimbabwe La ligne de temps
Cette échelle de temps montre un graphique de 1985 année à 2015 année Fragile and conflict affected situations. Les données jusqu'à 1984 année ne sont pas présentés. Quantité d'observations actuelles selon dates: 31.
Source (désignation):
Les indicateurs du développement mondiale
Source (organisation):
International Monetary Fund, International Financial Statistics and data files.
Catégories:
Economy & Growth, Financial Sector
Dernière mise à jour
23 avr. 2017
Les indicateurs de changement de valeurs selon les années
Minimum:
3.783
1 janv. 2014
Maximum:
24.204
1 janv. 1995
Pour la date d''observation
Valeur
Changement absolu
Le changement par rapport à la valeur précédente
1 janv. 1985
10.452
+10.452
0.0%
1 janv. 1986
9.353
-1.099
-10.51%
1 janv. 1987
11.627
+2.274
24.31%
1 janv. 1988
9.053
-2.575
-22.14%
1 janv. 1989
13.584
+4.531
50.05%
1 janv. 1990
9.013
-4.571
-33.65%
1 janv. 1991
11.784
+2.771
30.75%
1 janv. 1992
11.896
+0.112
0.95%
1 janv. 1993
11.009
-0.887
-7.46%
1 janv. 1994
11.074
+0.064
0.58%
1 janv. 1995
24.204
+13.131
118.58%
1 janv. 1996
19.263
-4.941
-20.41%
1 janv. 1997
11.774
-7.489
-38.88%
1 janv. 1998
8.084
-3.69
-31.34%
1 janv. 1999
8.014
-0.07
-0.87%
1 janv. 2000
8.02
+0.007
0.08%
1 janv. 2001
4.59
-3.43
-42.77%
1 janv. 2002
5.555
+0.965
21.02%
1 janv. 2003
6.763
+1.208
21.75%
1 janv. 2004
7.655
+0.892
13.19%
1 janv. 2005
4.505
-3.15
-41.16%
1 janv. 2006
7.89
+3.386
75.16%
1 janv. 2007
7.255
-0.635
-8.05%
1 janv. 2008
6.251
-1.004
-13.84%
1 janv. 2009
11.36
+5.109
81.73%
1 janv. 2010
3.941
-7.419
-65.31%
1 janv. 2011
3.95
+0.009
0.23%
1 janv. 2012
5.435
+1.485
37.59%
1 janv. 2013
6.074
+0.639
11.76%
1 janv. 2014
3.783
-2.291
-37.72%
1 janv. 2015
3.819
+0.036
0.96%
Classement des pays selon les statistiques actuelles par années


Commentaires: