29
/fr/
fr
AIzaSyAYiBZKx7MnpbEhh9jyipgxe19OcubqV5w
April 1, 2024
32501
Europe & Central Asia (IDA & IBRD countries)
TEC
false
2
1
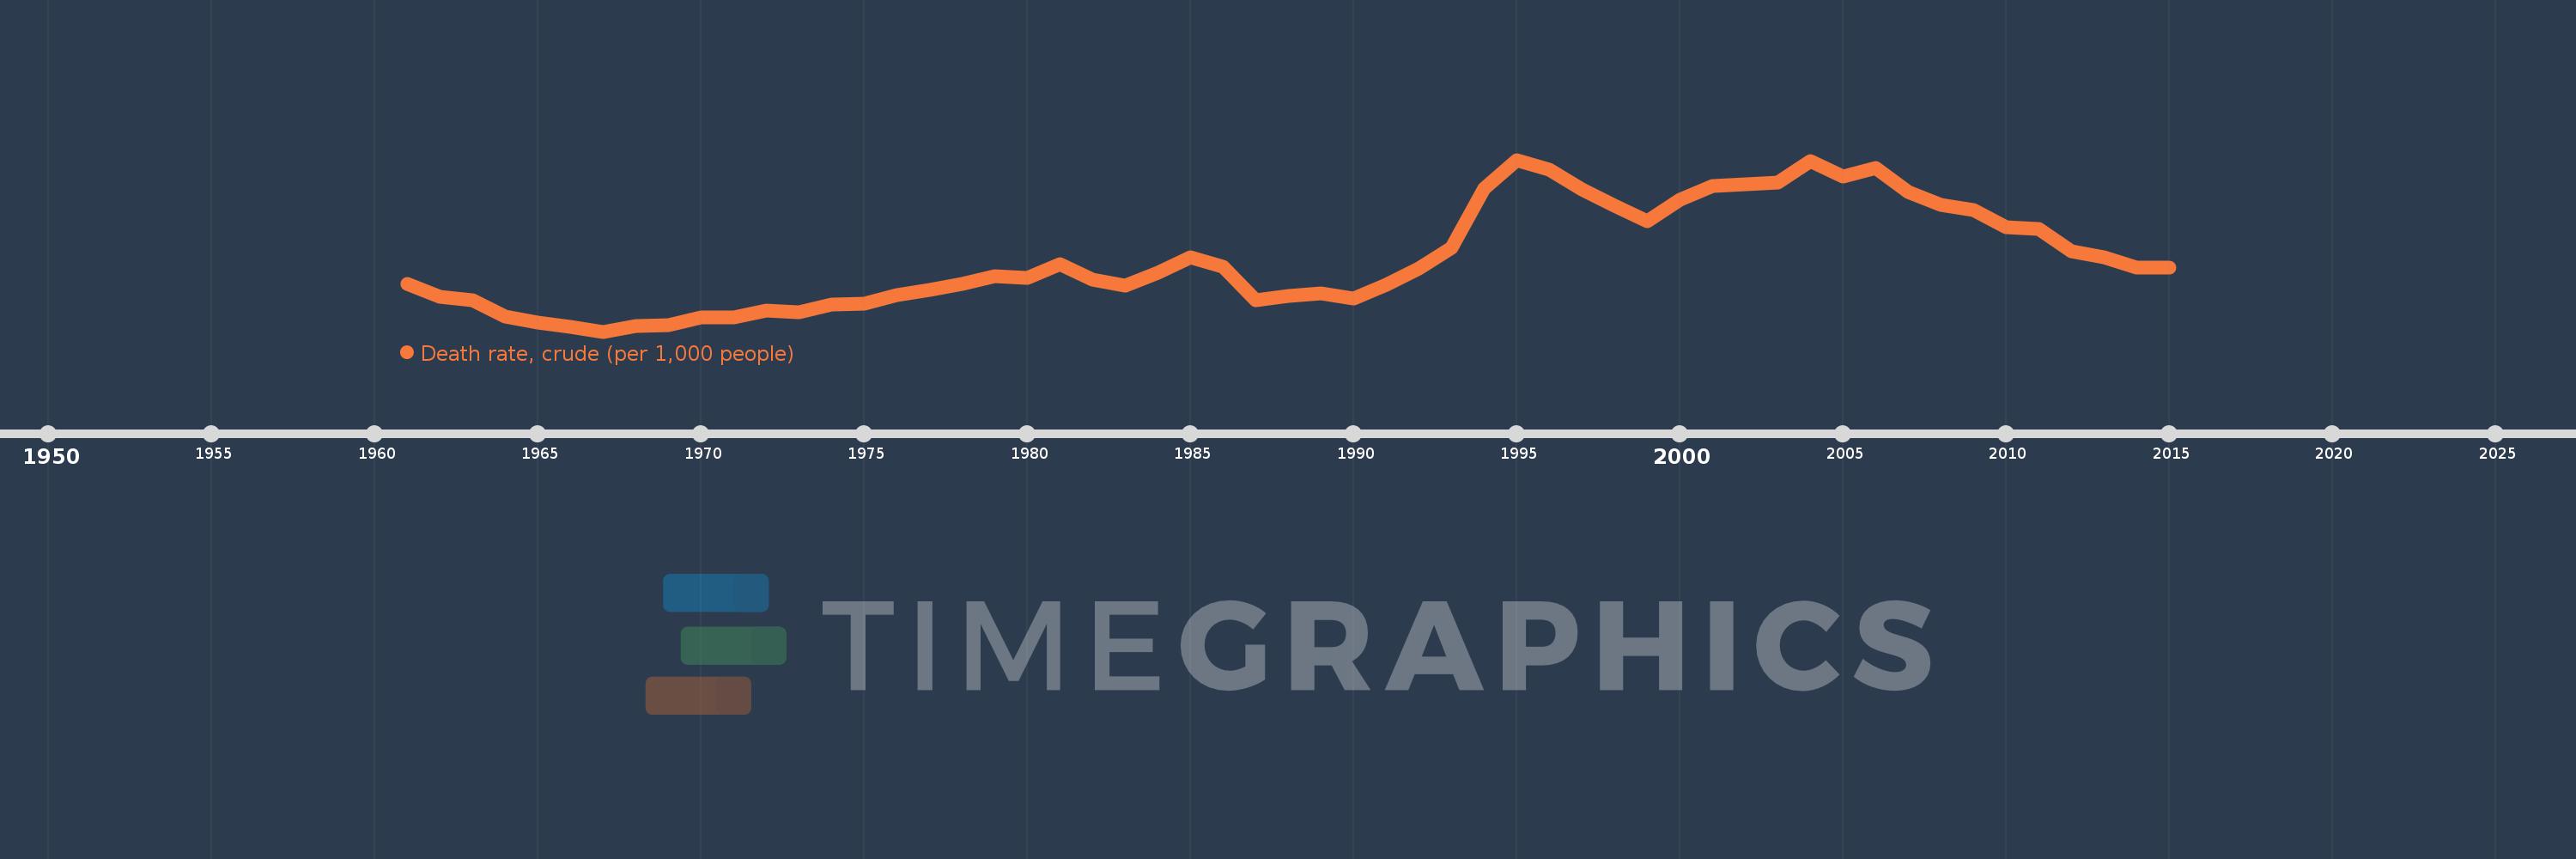
Death rate, crude (per 1,000 people)
2015,2014,2013,2012,2011,2010,2009,2008,2007,2006,2005,2004,2003,2002,2001,2000,1999,1998,1997,1996,1995,1994,1993,1992,1991,1990,1989,1988,1987,1986,1985,1984,1983,1982,1981,1980,1979,1978,1977,1976,1975,1974,1973,1972,1971,1970,1969,1968,1967,1966,1965,1964,1963,1962,1961
Cette statistique dans les autres pays:
AfghanistanAlbaniaAlgeriaAmerican SamoaAndorraAngolaAntigua and BarbudaArab WorldArgentinaArmeniaArubaAustraliaAustriaAzerbaijanBahamas, TheBahrainBangladeshBarbadosBelarusBelgiumBelizeBeninBermudaBhutanBoliviaBosnia and HerzegovinaBotswanaBrazilBrunei DarussalamBulgariaBurkina FasoBurundiCabo VerdeCambodiaCameroonCanadaCaribbean small statesCayman IslandsCentral African RepublicCentral Europe and the BalticsChadChannel IslandsChileChinaColombiaComorosCongo, Dem. Rep.Congo, Rep.Costa RicaCote d'IvoireCroatiaCubaCuracaoCyprusCzech RepublicDenmarkDjiboutiDominicaDominican RepublicEarly-demographic dividendEast Asia & PacificEast Asia & Pacific (excluding high income)East Asia & Pacific (IDA & IBRD countries)EcuadorEgypt, Arab Rep.El SalvadorEquatorial GuineaEritreaEstoniaEthiopiaEuro areaEurope & Central AsiaEurope & Central Asia (excluding high income)Europe & Central Asia (IDA & IBRD countries)European UnionFaroe IslandsFijiFinlandFragile and conflict affected situationsFranceFrench PolynesiaGabonGambia, TheGeorgiaGermanyGhanaGreeceGreenlandGrenadaGuamGuatemalaGuineaGuinea-BissauGuyanaHaitiHeavily indebted poor countries (HIPC)High incomeHondurasHong Kong SAR, ChinaHungaryIBRD onlyIcelandIDA & IBRD totalIDA blendIDA onlyIDA totalIndiaIndonesiaIran, Islamic Rep.IraqIrelandIsle of ManIsraelItalyJamaicaJapanJordanKazakhstanKenyaKiribatiKorea, Dem. People’s Rep.Korea, Rep.KosovoKuwaitKyrgyz RepublicLao PDRLate-demographic dividendLatin America & Caribbean Latin America & Caribbean (excluding high income)Latin America & the Caribbean (IDA & IBRD countries)LatviaLeast developed countries: UN classificationLebanonLesothoLiberiaLibyaLiechtensteinLithuaniaLow & middle incomeLow incomeLower middle incomeLuxembourgMacao SAR, ChinaMacedonia, FYRMadagascarMalawiMalaysiaMaldivesMaliMaltaMarshall IslandsMauritaniaMauritiusMexicoMicronesia, Fed. Sts.Middle East & North AfricaMiddle East & North Africa (excluding high income)Middle East & North Africa (IDA & IBRD countries)Middle incomeMoldovaMonacoMongoliaMontenegroMoroccoMozambiqueMyanmarNamibiaNepalNetherlandsNew CaledoniaNew ZealandNicaraguaNigerNigeriaNorth AmericaNorwayOECD membersOmanOther small statesPacific island small statesPakistanPalauPanamaPapua New GuineaParaguayPeruPhilippinesPolandPortugalPost-demographic dividendPre-demographic dividendPuerto RicoQatarRomaniaRussian FederationRwandaSamoaSan MarinoSao Tome and PrincipeSaudi ArabiaSenegalSerbiaSeychellesSierra LeoneSingaporeSint Maarten (Dutch part)Slovak RepublicSloveniaSmall statesSolomon IslandsSomaliaSouth AfricaSouth AsiaSouth Asia (IDA & IBRD)South SudanSpainSri LankaSt. Kitts and NevisSt. LuciaSt. Martin (French part)St. Vincent and the GrenadinesSub-Saharan Africa Sub-Saharan Africa (excluding high income)Sub-Saharan Africa (IDA & IBRD countries)SudanSurinameSwazilandSwedenSwitzerlandSyrian Arab RepublicTajikistanTanzaniaThailandTimor-LesteTogoTongaTrinidad and TobagoTunisiaTurkeyTurkmenistanUgandaUkraineUnited Arab EmiratesUnited KingdomUnited StatesUpper middle incomeUruguayUzbekistanVanuatuVenezuela, RBVietnamVirgin Islands (U.S.)West Bank and GazaWorldYemen, Rep.ZambiaZimbabwe La ligne de temps
Cette échelle de temps montre un graphique de 1961 année à 2015 année Europe & Central Asia (IDA & IBRD countries). Les données jusqu'à 1960 année ne sont pas présentés. Quantité d'observations actuelles selon dates: 55.
Source (désignation):
Les indicateurs du développement mondiale
Source (organisation):
(1) United Nations Population Division. World Population Prospects, (2) Census reports and other statistical publications from national statistical offices, (3) Eurostat: Demographic Statistics, (4) United Nations Statistical Division. Population and Vital Statistics Reprot (various years), (5) U.S. Census Bureau: International Database, and (6) Secretariat of the Pacific Community: Statistics and Demography Programme.
Catégories:
Health
Dernière mise à jour
23 avr. 2017
Les indicateurs de changement de valeurs selon les années
Minimum:
9.345
1 janv. 1967
Maximum:
12.07
1 janv. 1995
Pour la date d''observation
Valeur
Changement absolu
Le changement par rapport à la valeur précédente
1 janv. 1961
10.104
+10.104
0.0%
1 janv. 1962
9.902
-0.202
-1.99%
1 janv. 1963
9.837
-0.065
-0.66%
1 janv. 1964
9.587
-0.249
-2.53%
1 janv. 1965
9.487
-0.1
-1.04%
1 janv. 1966
9.418
-0.069
-0.73%
1 janv. 1967
9.345
-0.073
-0.78%
1 janv. 1968
9.438
+0.093
0.99%
1 janv. 1969
9.442
+0.004
0.04%
1 janv. 1970
9.576
+0.134
1.41%
1 janv. 1971
9.565
-0.011
-0.12%
1 janv. 1972
9.675
+0.11
1.15%
1 janv. 1973
9.658
-0.017
-0.17%
1 janv. 1974
9.778
+0.12
1.24%
1 janv. 1975
9.788
+0.01
0.1%
1 janv. 1976
9.927
+0.139
1.42%
1 janv. 1977
10.001
+0.073
0.74%
1 janv. 1978
10.102
+0.101
1.01%
1 janv. 1979
10.224
+0.122
1.21%
1 janv. 1980
10.203
-0.022
-0.21%
1 janv. 1981
10.415
+0.212
2.08%
1 janv. 1982
10.175
-0.239
-2.3%
1 janv. 1983
10.075
-0.101
-0.99%
1 janv. 1984
10.274
+0.2
1.98%
1 janv. 1985
10.524
+0.25
2.43%
1 janv. 1986
10.372
-0.152
-1.44%
1 janv. 1987
9.838
-0.534
-5.15%
1 janv. 1988
9.916
+0.078
0.79%
1 janv. 1989
9.955
+0.039
0.39%
1 janv. 1990
9.868
-0.087
-0.87%
1 janv. 1991
10.088
+0.22
2.23%
1 janv. 1992
10.349
+0.261
2.59%
1 janv. 1993
10.674
+0.325
3.14%
1 janv. 1994
11.616
+0.941
8.82%
1 janv. 1995
12.07
+0.454
3.91%
1 janv. 1996
11.911
-0.158
-1.31%
1 janv. 1997
11.601
-0.31
-2.61%
1 janv. 1998
11.338
-0.263
-2.27%
1 janv. 1999
11.091
-0.247
-2.18%
1 janv. 2000
11.439
+0.348
3.14%
1 janv. 2001
11.651
+0.212
1.85%
1 janv. 2002
11.686
+0.035
0.3%
1 janv. 2003
11.707
+0.02
0.17%
1 janv. 2004
12.043
+0.336
2.87%
1 janv. 2005
11.81
-0.233
-1.93%
1 janv. 2006
11.944
+0.133
1.13%
1 janv. 2007
11.553
-0.391
-3.27%
1 janv. 2008
11.348
-0.205
-1.77%
1 janv. 2009
11.271
-0.077
-0.68%
1 janv. 2010
11.006
-0.264
-2.35%
1 janv. 2011
10.974
-0.032
-0.29%
1 janv. 2012
10.615
-0.359
-3.27%
1 janv. 2013
10.529
-0.085
-0.81%
1 janv. 2014
10.36
-0.169
-1.61%
1 janv. 2015
10.366
+0.006
0.06%
Classement des pays selon les statistiques actuelles par années


Commentaires: