29
/fr/
fr
AIzaSyAYiBZKx7MnpbEhh9jyipgxe19OcubqV5w
April 1, 2024
32108
Europe & Central Asia (excluding high income)
ECA
false
2
1
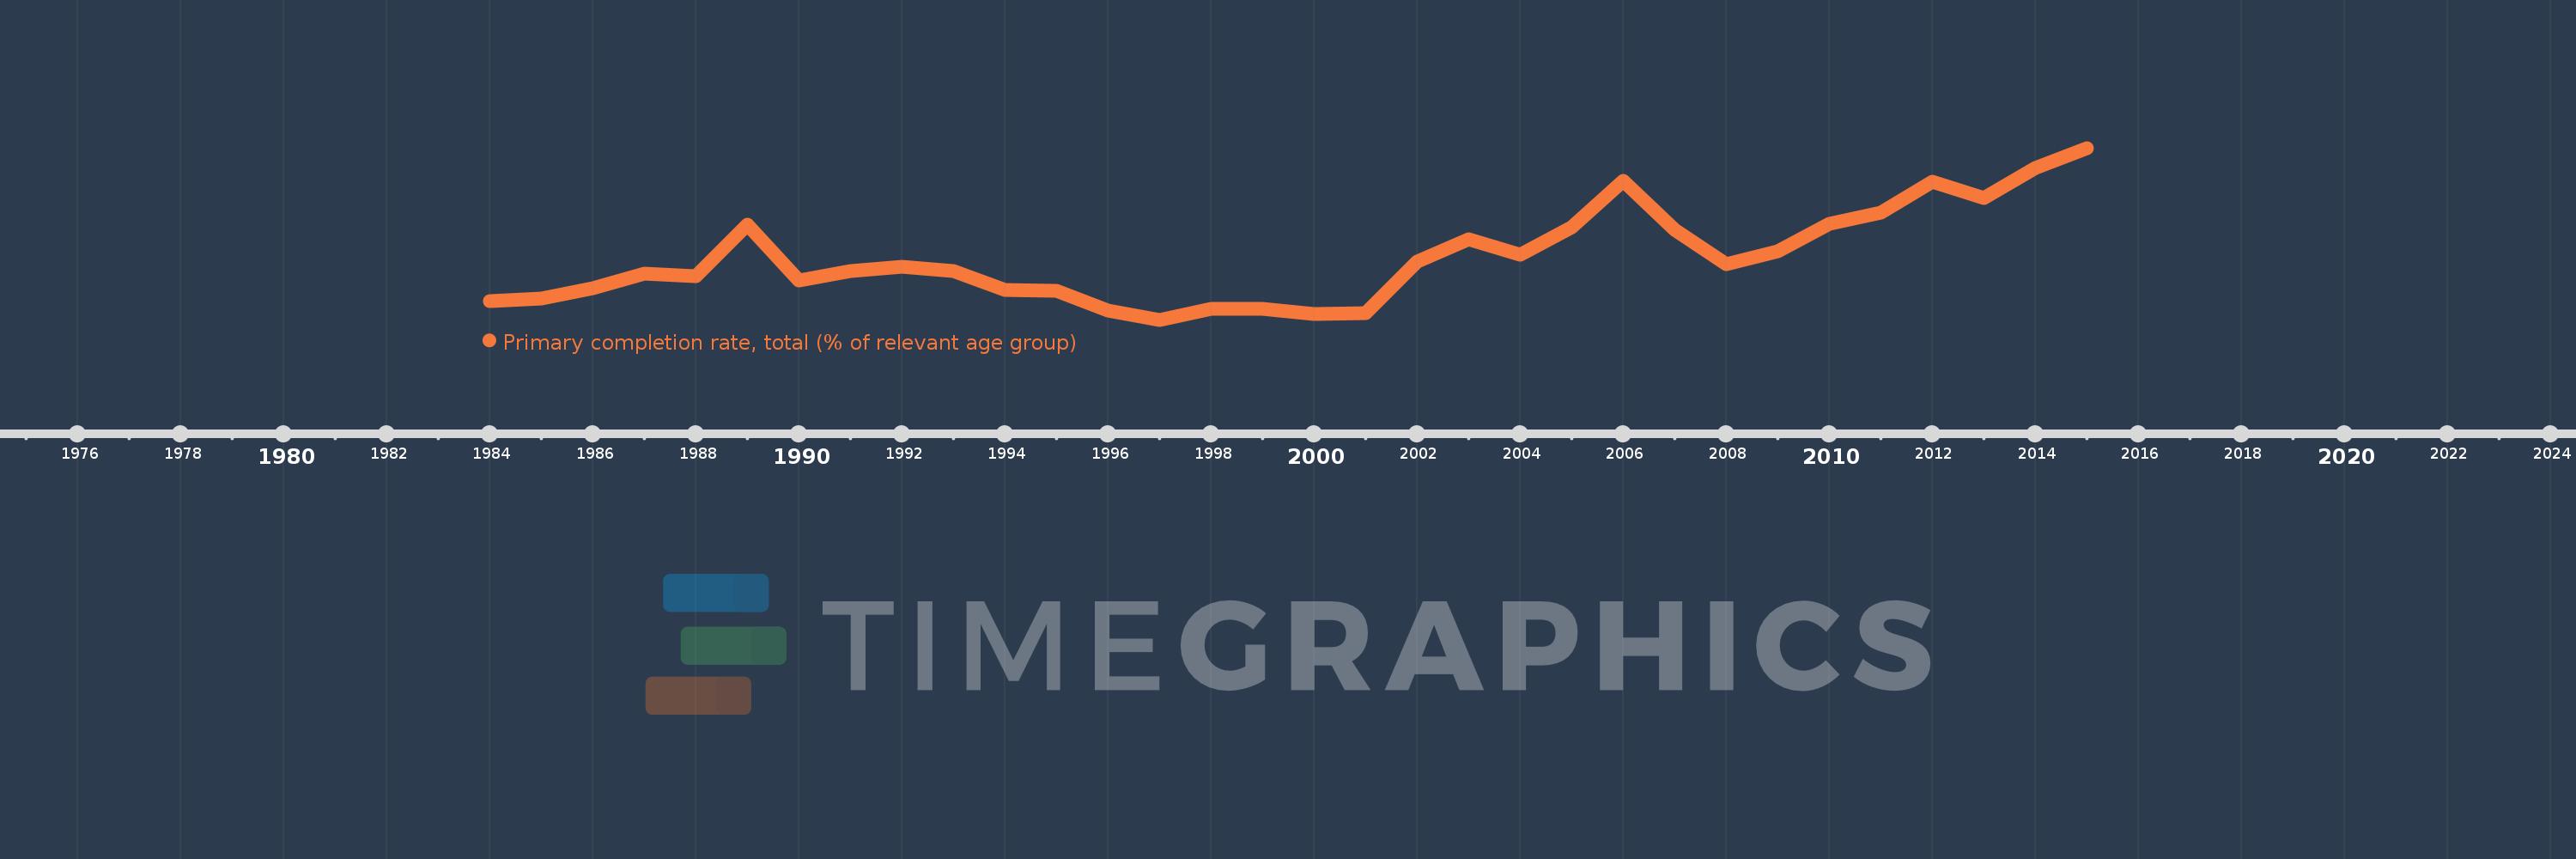
Primary completion rate, total (% of relevant age group)
2015,2014,2013,2012,2011,2010,2009,2008,2007,2006,2005,2004,2003,2002,2001,2000,1999,1998,1997,1996,1995,1994,1993,1992,1991,1990,1989,1988,1987,1986,1985,1984
Cette statistique dans les autres pays:
AfghanistanAlbaniaAlgeriaAngolaAntigua and BarbudaArab WorldArgentinaArmeniaArubaAustriaAzerbaijanBahamas, TheBahrainBangladeshBarbadosBelarusBelgiumBelizeBeninBermudaBhutanBoliviaBosnia and HerzegovinaBotswanaBrazilBritish Virgin IslandsBrunei DarussalamBulgariaBurkina FasoBurundiCabo VerdeCambodiaCameroonCanadaCaribbean small statesCentral African RepublicCentral Europe and the BalticsChadChileChinaColombiaComorosCongo, Dem. Rep.Congo, Rep.Costa RicaCote d'IvoireCroatiaCubaCyprusCzech RepublicDenmarkDjiboutiDominicaDominican RepublicEarly-demographic dividendEast Asia & PacificEast Asia & Pacific (excluding high income)East Asia & Pacific (IDA & IBRD countries)EcuadorEgypt, Arab Rep.El SalvadorEquatorial GuineaEritreaEstoniaEthiopiaEuro areaEurope & Central AsiaEurope & Central Asia (excluding high income)Europe & Central Asia (IDA & IBRD countries)European UnionFijiFinlandFragile and conflict affected situationsFranceGabonGambia, TheGeorgiaGermanyGhanaGreeceGrenadaGuatemalaGuineaGuinea-BissauGuyanaHaitiHeavily indebted poor countries (HIPC)High incomeHondurasHong Kong SAR, ChinaHungaryIBRD onlyIcelandIDA & IBRD totalIDA blendIDA onlyIDA totalIndiaIndonesiaIran, Islamic Rep.IraqIrelandIsraelItalyJamaicaJapanJordanKazakhstanKenyaKiribatiKorea, Dem. People’s Rep.Korea, Rep.KuwaitKyrgyz RepublicLao PDRLate-demographic dividendLatin America & Caribbean Latin America & Caribbean (excluding high income)Latin America & the Caribbean (IDA & IBRD countries)LatviaLeast developed countries: UN classificationLebanonLesothoLiberiaLibyaLiechtensteinLithuaniaLow & middle incomeLow incomeLower middle incomeLuxembourgMacao SAR, ChinaMacedonia, FYRMadagascarMalawiMalaysiaMaldivesMaliMaltaMarshall IslandsMauritaniaMauritiusMexicoMiddle East & North AfricaMiddle East & North Africa (excluding high income)Middle East & North Africa (IDA & IBRD countries)Middle incomeMoldovaMongoliaMontenegroMoroccoMozambiqueMyanmarNamibiaNauruNepalNetherlandsNew ZealandNicaraguaNigerNigeriaNorwayOECD membersOmanOther small statesPacific island small statesPakistanPalauPanamaPapua New GuineaParaguayPeruPhilippinesPolandPortugalPost-demographic dividendPre-demographic dividendQatarRomaniaRussian FederationRwandaSamoaSan MarinoSao Tome and PrincipeSaudi ArabiaSenegalSerbiaSeychellesSierra LeoneSlovak RepublicSloveniaSmall statesSolomon IslandsSouth AfricaSouth AsiaSouth Asia (IDA & IBRD)South SudanSpainSri LankaSt. Kitts and NevisSt. LuciaSt. Vincent and the GrenadinesSub-Saharan Africa Sub-Saharan Africa (excluding high income)Sub-Saharan Africa (IDA & IBRD countries)SudanSurinameSwazilandSwedenSwitzerlandSyrian Arab RepublicTajikistanTanzaniaThailandTimor-LesteTogoTongaTrinidad and TobagoTunisiaTurkeyTuvaluUgandaUkraineUnited Arab EmiratesUpper middle incomeUruguayUzbekistanVanuatuVenezuela, RBVietnamWest Bank and GazaWorldYemen, Rep.ZambiaZimbabwe La ligne de temps
Cette échelle de temps montre un graphique de 1984 année à 2015 année Europe & Central Asia (excluding high income). Les données jusqu'à 1983 année ne sont pas présentés. Quantité d'observations actuelles selon dates: 32.
Source (désignation):
Les indicateurs du développement mondiale
Source (organisation):
United Nations Educational, Scientific, and Cultural Organization (UNESCO) Institute for Statistics.
Catégories:
Aid Effectiveness, Climate Change, Education
Dernière mise à jour
23 avr. 2017
Les indicateurs de changement de valeurs selon les années
Minimum:
93.388
1 janv. 1997
Maximum:
100.882
1 janv. 2015
Pour la date d''observation
Valeur
Changement absolu
Le changement par rapport à la valeur précédente
1 janv. 1984
94.186
+94.186
0.0%
1 janv. 1985
94.301
+0.115
0.12%
1 janv. 1986
94.754
+0.453
0.48%
1 janv. 1987
95.402
+0.647
0.68%
1 janv. 1988
95.284
-0.117
-0.12%
1 janv. 1989
97.525
+2.241
2.35%
1 janv. 1990
95.106
-2.419
-2.48%
1 janv. 1991
95.51
+0.404
0.42%
1 janv. 1992
95.692
+0.182
0.19%
1 janv. 1993
95.513
-0.18
-0.19%
1 janv. 1994
94.693
-0.82
-0.86%
1 janv. 1995
94.651
-0.041
-0.04%
1 janv. 1996
93.781
-0.87
-0.92%
1 janv. 1997
93.388
-0.393
-0.42%
1 janv. 1998
93.853
+0.465
0.5%
1 janv. 1999
93.867
+0.014
0.01%
1 janv. 2000
93.654
-0.213
-0.23%
1 janv. 2001
93.686
+0.032
0.03%
1 janv. 2002
95.923
+2.237
2.39%
1 janv. 2003
96.901
+0.978
1.02%
1 janv. 2004
96.238
-0.663
-0.68%
1 janv. 2005
97.423
+1.185
1.23%
1 janv. 2006
99.44
+2.018
2.07%
1 janv. 2007
97.3
-2.14
-2.15%
1 janv. 2008
95.803
-1.497
-1.54%
1 janv. 2009
96.383
+0.581
0.61%
1 janv. 2010
97.575
+1.192
1.24%
1 janv. 2011
98.071
+0.496
0.51%
1 janv. 2012
99.397
+1.325
1.35%
1 janv. 2013
98.69
-0.707
-0.71%
1 janv. 2014
100.007
+1.317
1.33%
1 janv. 2015
100.882
+0.875
0.88%
Classement des pays selon les statistiques actuelles par années


Commentaires: