29
/fr/
fr
AIzaSyAYiBZKx7MnpbEhh9jyipgxe19OcubqV5w
April 1, 2024
31889
Europe & Central Asia (excluding high income)
ECA
false
2
1
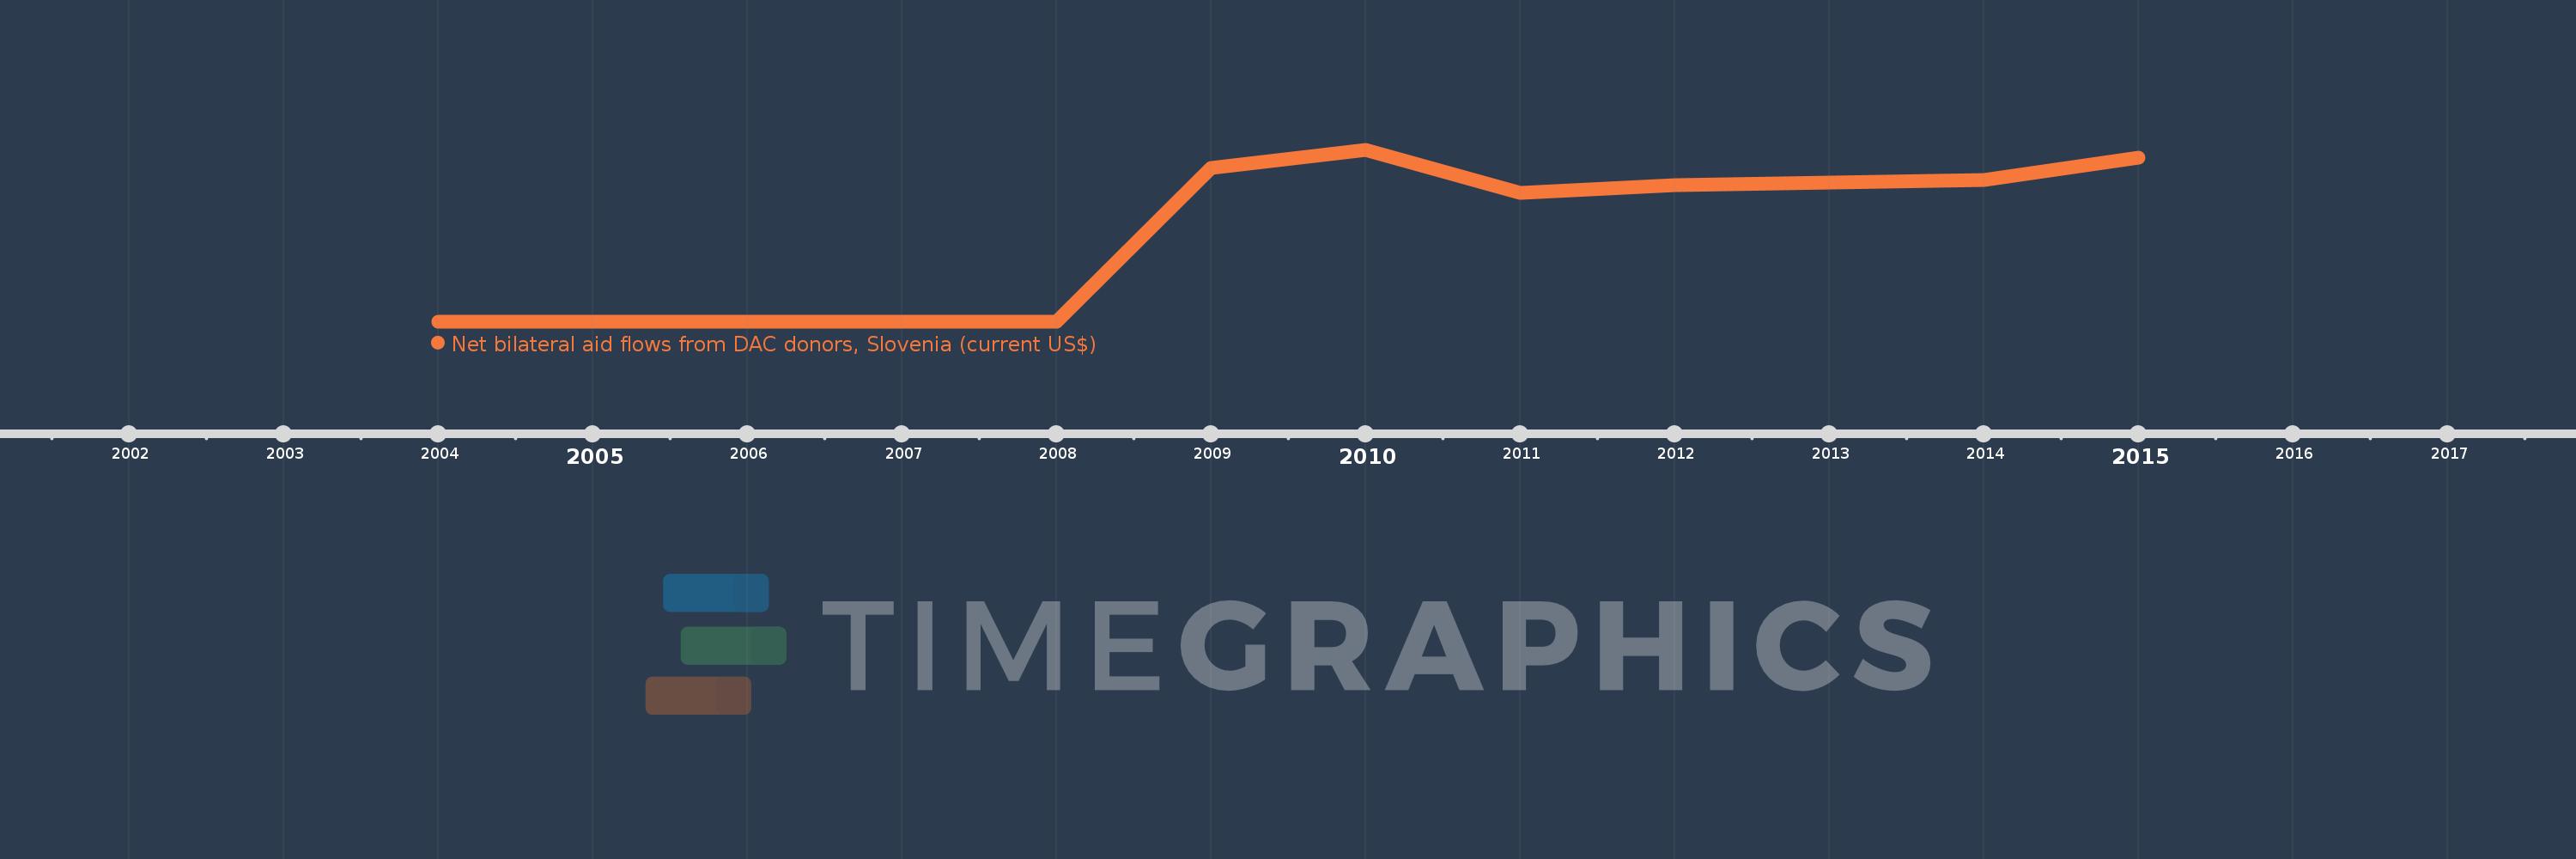
Net bilateral aid flows from DAC donors, Slovenia (current US$)
2015,2014,2013,2012,2011,2010,2009,2008,2007,2006,2005,2004
Cette statistique dans les autres pays:
La ligne de temps
Cette échelle de temps montre un graphique de 2004 année à 2015 année Europe & Central Asia (excluding high income). Les données jusqu'à 2003 année ne sont pas présentés. Quantité d'observations actuelles selon dates: 12.
Source (désignation):
Les indicateurs du développement mondiale
Source (organisation):
Development Assistance Committee of the Organisation for Economic Co-operation and Development, Geographical Distribution of Financial Flows to Developing Countries, Development Co-operation Report, and International Development Statistics database. Data are available online at: www.oecd.org/dac/stats/idsonline.
Catégories:
Aid Effectiveness
Dernière mise à jour
23 avr. 2017
Les indicateurs de changement de valeurs selon les années
Maximum:
12.59 mln.
1 janv. 2010
Pour la date d''observation
Valeur
Changement absolu
Le changement par rapport à la valeur précédente
1 janv. 2009
11.31 mln.
+11.31 mln.
%
1 janv. 2010
12.59 mln.
+1.28 mln.
11.32%
1 janv. 2011
9.48 mln.
-3.11 mln.
-24.7%
1 janv. 2012
10.05 mln.
+570.0 milles
6.01%
1 janv. 2013
10.19 mln.
+140.0 milles
1.39%
1 janv. 2014
10.42 mln.
+230.0 milles
2.26%
1 janv. 2015
12.06 mln.
+1.64 mln.
15.74%
Classement des pays selon les statistiques actuelles par années


Commentaires: