29
/fr/
fr
AIzaSyAYiBZKx7MnpbEhh9jyipgxe19OcubqV5w
April 1, 2024
30055
Euro area
EMU
false
2
1
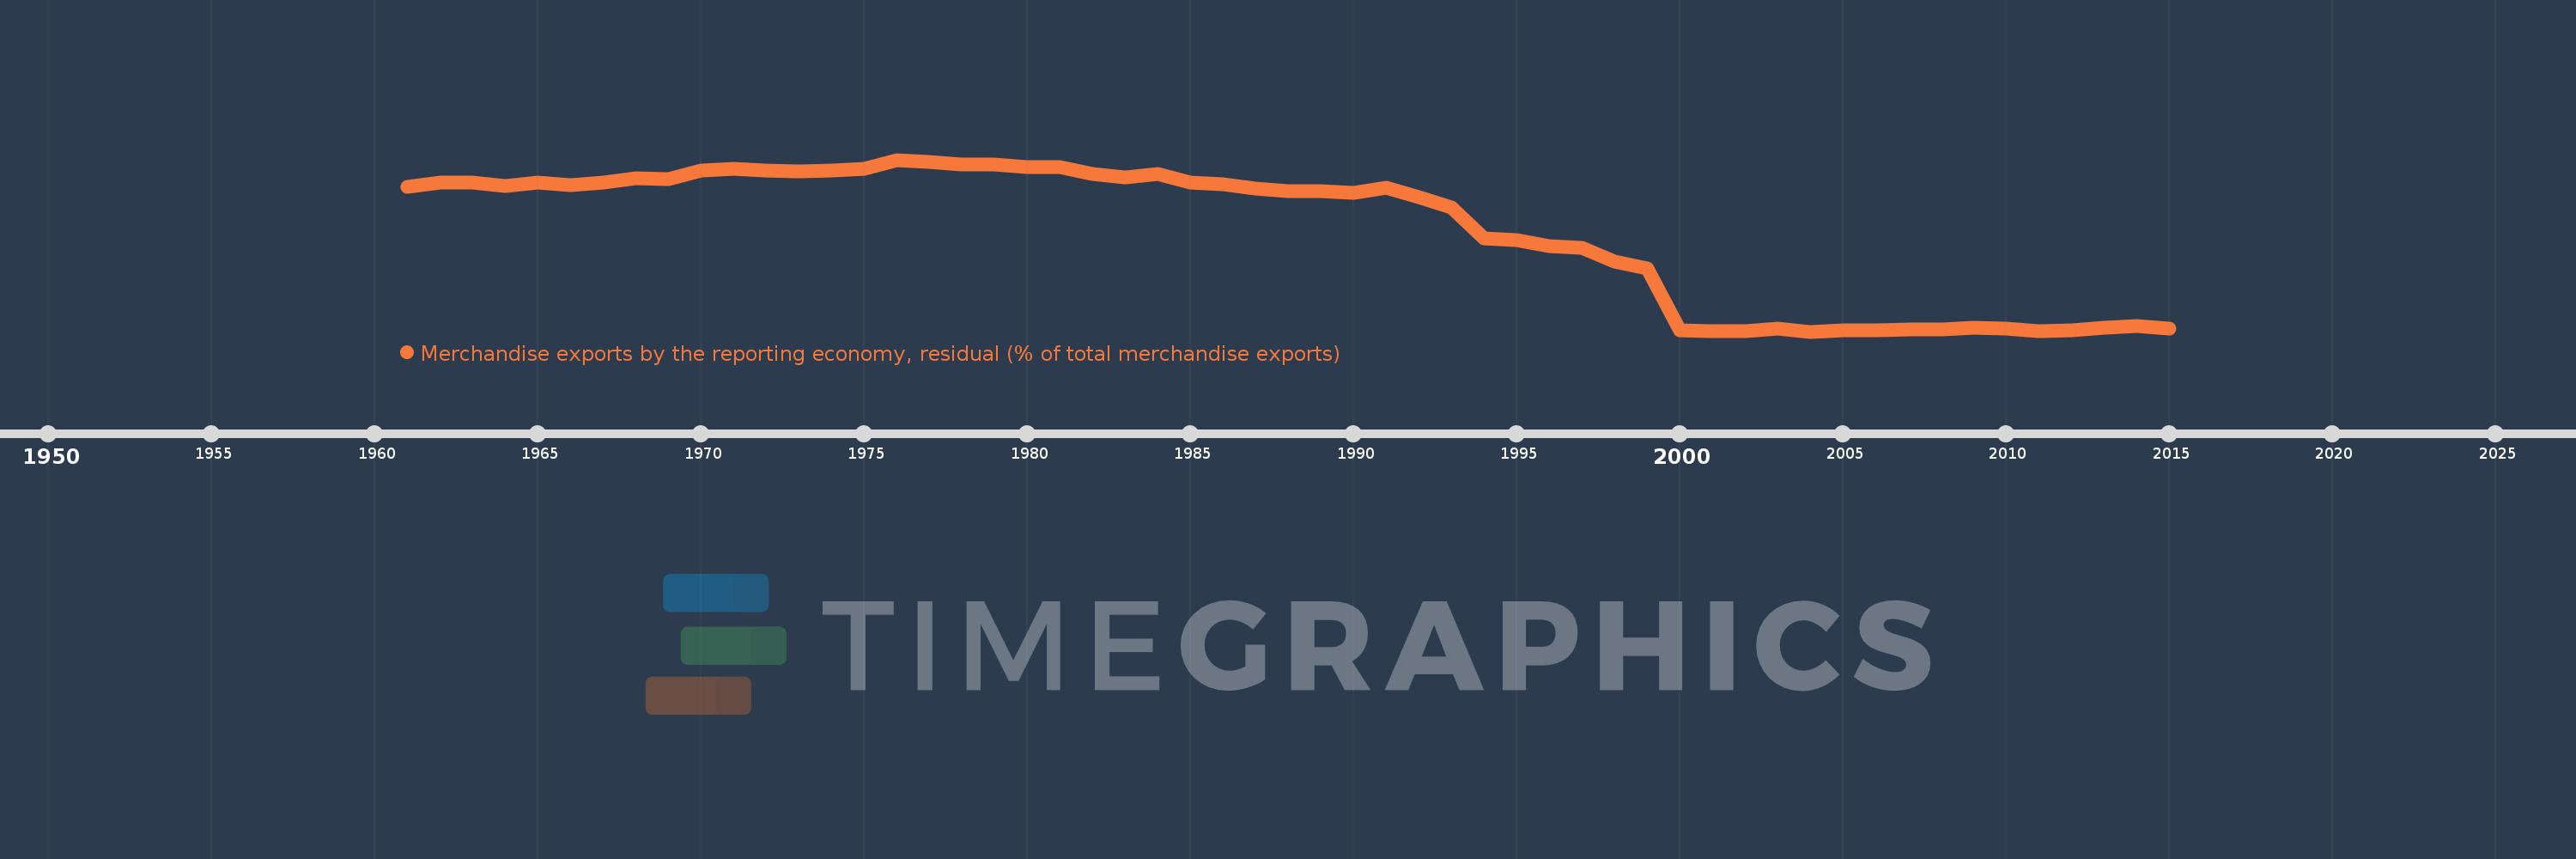
Merchandise exports by the reporting economy, residual (% of total merchandise exports)
2015,2014,2013,2012,2011,2010,2009,2008,2007,2006,2005,2004,2003,2002,2001,2000,1999,1998,1997,1996,1995,1994,1993,1992,1991,1990,1989,1988,1987,1986,1985,1984,1983,1982,1981,1980,1979,1978,1977,1976,1975,1974,1973,1972,1971,1970,1969,1968,1967,1966,1965,1964,1963,1962,1961
Cette statistique dans les autres pays:
AfghanistanAlbaniaAlgeriaAmerican SamoaAngolaAntigua and BarbudaArab WorldArgentinaArmeniaArubaAustraliaAustriaAzerbaijanBahamas, TheBahrainBangladeshBarbadosBelarusBelgiumBelizeBeninBermudaBoliviaBosnia and HerzegovinaBrazilBrunei DarussalamBulgariaBurkina FasoBurundiCabo VerdeCambodiaCameroonCanadaCaribbean small statesCentral African RepublicCentral Europe and the BalticsChadChileChinaColombiaComorosCongo, Dem. Rep.Congo, Rep.Costa RicaCote d'IvoireCroatiaCubaCyprusCzech RepublicDenmarkDjiboutiDominicaDominican RepublicEarly-demographic dividendEast Asia & PacificEast Asia & Pacific (excluding high income)East Asia & Pacific (IDA & IBRD countries)EcuadorEgypt, Arab Rep.El SalvadorEquatorial GuineaEstoniaEthiopiaEuro areaEurope & Central AsiaEurope & Central Asia (excluding high income)Europe & Central Asia (IDA & IBRD countries)European UnionFaroe IslandsFijiFinlandFragile and conflict affected situationsFranceFrench PolynesiaGabonGambia, TheGeorgiaGermanyGhanaGibraltarGreeceGreenlandGrenadaGuamGuatemalaGuineaGuinea-BissauGuyanaHaitiHeavily indebted poor countries (HIPC)High incomeHondurasHong Kong SAR, ChinaHungaryIBRD onlyIcelandIDA & IBRD totalIDA blendIDA onlyIDA totalIndiaIndonesiaIran, Islamic Rep.IraqIrelandIsraelItalyJamaicaJapanJordanKazakhstanKenyaKiribatiKorea, Dem. People’s Rep.Korea, Rep.KosovoKuwaitKyrgyz RepublicLao PDRLate-demographic dividendLatin America & Caribbean Latin America & Caribbean (excluding high income)Latin America & the Caribbean (IDA & IBRD countries)LatviaLeast developed countries: UN classificationLebanonLiberiaLibyaLithuaniaLow & middle incomeLow incomeLower middle incomeLuxembourgMacao SAR, ChinaMacedonia, FYRMadagascarMalawiMalaysiaMaldivesMaliMaltaMauritaniaMauritiusMexicoMiddle East & North AfricaMiddle East & North Africa (excluding high income)Middle East & North Africa (IDA & IBRD countries)Middle incomeMoldovaMongoliaMontenegroMoroccoMozambiqueMyanmarNauruNepalNetherlandsNew CaledoniaNew ZealandNicaraguaNigerNigeriaNorth AmericaNorwayOECD membersOmanOther small statesPacific island small statesPakistanPanamaPapua New GuineaParaguayPeruPhilippinesPolandPortugalPost-demographic dividendPre-demographic dividendQatarRomaniaRussian FederationRwandaSamoaSao Tome and PrincipeSaudi ArabiaSenegalSerbiaSeychellesSierra LeoneSingaporeSlovak RepublicSloveniaSmall statesSolomon IslandsSomaliaSouth AfricaSouth AsiaSouth Asia (IDA & IBRD)SpainSri LankaSt. Kitts and NevisSt. LuciaSt. Vincent and the GrenadinesSub-Saharan Africa Sub-Saharan Africa (excluding high income)Sub-Saharan Africa (IDA & IBRD countries)SudanSurinameSwedenSwitzerlandSyrian Arab RepublicTajikistanTanzaniaThailandTogoTongaTrinidad and TobagoTunisiaTurkeyTurkmenistanTuvaluUgandaUkraineUnited Arab EmiratesUnited KingdomUnited StatesUpper middle incomeUruguayUzbekistanVanuatuVenezuela, RBVietnamWorldYemen, Rep.ZambiaZimbabwe La ligne de temps
Cette échelle de temps montre un graphique de 1961 année à 2015 année Euro area. Les données jusqu'à 1960 année ne sont pas présentés. Quantité d'observations actuelles selon dates: 55.
Source (désignation):
Les indicateurs du développement mondiale
Source (organisation):
World Bank staff estimates based data from International Monetary Fund's Direction of Trade database.
Catégories:
Private Sector, Trade
Dernière mise à jour
23 avr. 2017
Les indicateurs de changement de valeurs selon les années
Minimum:
0.941
1 janv. 2004
Maximum:
14.343
1 janv. 1976
Pour la date d''observation
Valeur
Changement absolu
Le changement par rapport à la valeur précédente
1 janv. 1961
12.217
+12.217
0.0%
1 janv. 1962
12.553
+0.335
2.75%
1 janv. 1963
12.541
-0.012
-0.1%
1 janv. 1964
12.267
-0.274
-2.19%
1 janv. 1965
12.6
+0.334
2.72%
1 janv. 1966
12.36
-0.24
-1.91%
1 janv. 1967
12.591
+0.231
1.87%
1 janv. 1968
12.881
+0.29
2.31%
1 janv. 1969
12.815
-0.066
-0.51%
1 janv. 1970
13.492
+0.677
5.28%
1 janv. 1971
13.62
+0.128
0.95%
1 janv. 1972
13.52
-0.099
-0.73%
1 janv. 1973
13.41
-0.11
-0.81%
1 janv. 1974
13.475
+0.065
0.48%
1 janv. 1975
13.642
+0.167
1.24%
1 janv. 1976
14.343
+0.701
5.14%
1 janv. 1977
14.196
-0.147
-1.03%
1 janv. 1978
14.006
-0.189
-1.33%
1 janv. 1979
13.963
-0.043
-0.31%
1 janv. 1980
13.784
-0.179
-1.28%
1 janv. 1981
13.786
+0.002
0.02%
1 janv. 1982
13.233
-0.554
-4.02%
1 janv. 1983
12.988
-0.245
-1.85%
1 janv. 1984
13.244
+0.256
1.97%
1 janv. 1985
12.579
-0.665
-5.02%
1 janv. 1986
12.44
-0.14
-1.11%
1 janv. 1987
12.114
-0.326
-2.62%
1 janv. 1988
11.872
-0.242
-2.0%
1 janv. 1989
11.877
+0.005
0.04%
1 janv. 1990
11.782
-0.096
-0.81%
1 janv. 1991
12.136
+0.355
3.01%
1 janv. 1992
11.412
-0.724
-5.97%
1 janv. 1993
10.624
-0.788
-6.91%
1 janv. 1994
8.204
-2.42
-22.78%
1 janv. 1995
8.094
-0.109
-1.33%
1 janv. 1996
7.597
-0.497
-6.15%
1 janv. 1997
7.468
-0.128
-1.69%
1 janv. 1998
6.41
-1.058
-14.17%
1 janv. 1999
5.859
-0.551
-8.6%
1 janv. 2000
1.04
-4.819
-82.25%
1 janv. 2001
0.998
-0.042
-4.06%
1 janv. 2002
0.977
-0.021
-2.06%
1 janv. 2003
1.156
+0.179
18.33%
1 janv. 2004
0.941
-0.216
-18.66%
1 janv. 2005
1.056
+0.115
12.25%
1 janv. 2006
1.026
-0.03
-2.86%
1 janv. 2007
1.091
+0.065
6.38%
1 janv. 2008
1.124
+0.033
3.05%
1 janv. 2009
1.232
+0.108
9.6%
1 janv. 2010
1.207
-0.025
-2.04%
1 janv. 2011
0.942
-0.265
-21.95%
1 janv. 2012
1.057
+0.115
12.19%
1 janv. 2013
1.224
+0.167
15.76%
1 janv. 2014
1.364
+0.141
11.5%
1 janv. 2015
1.196
-0.168
-12.33%
Classement des pays selon les statistiques actuelles par années


Commentaires: