29
/fr/
fr
AIzaSyAYiBZKx7MnpbEhh9jyipgxe19OcubqV5w
April 1, 2024
29243
East Asia & Pacific (IDA & IBRD countries)
TEA
false
2
1
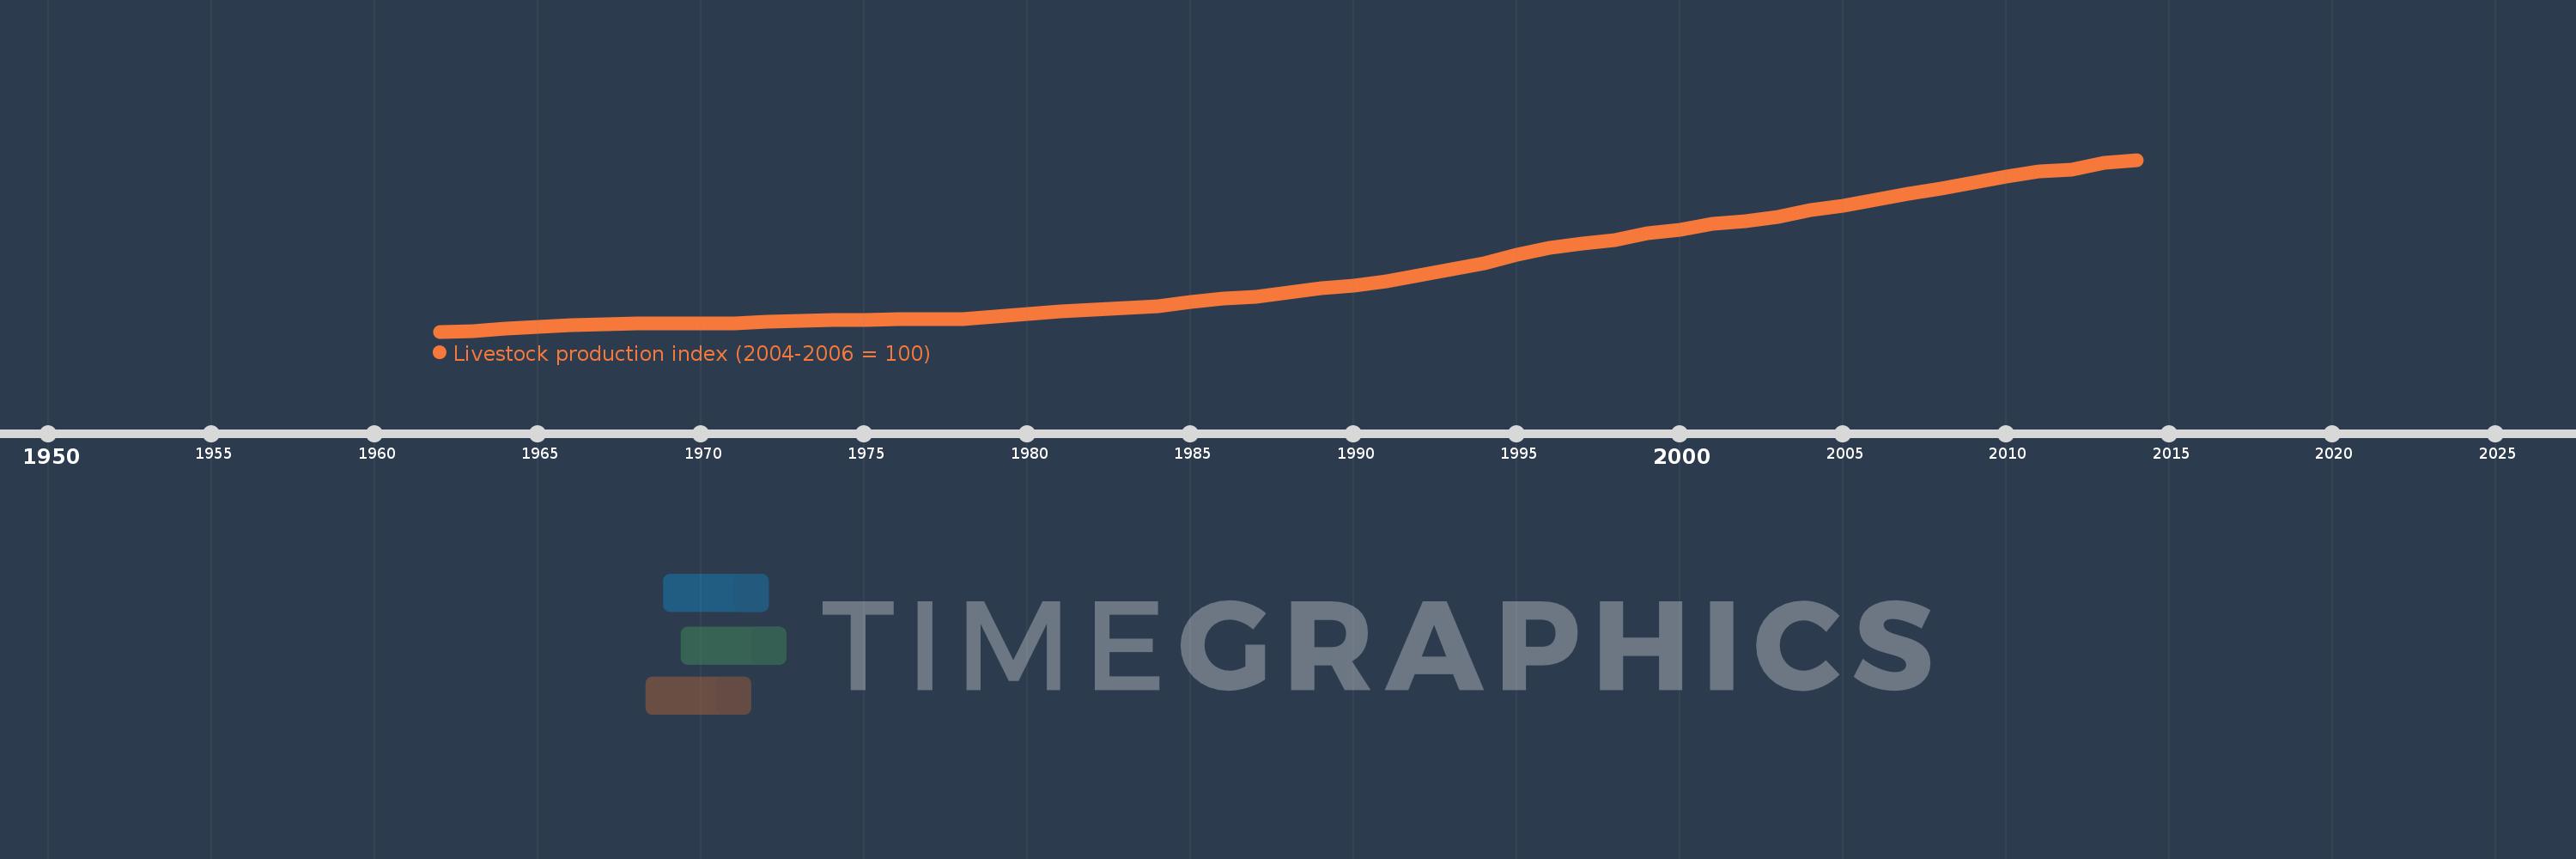
Livestock production index (2004-2006 = 100)
2014,2013,2012,2011,2010,2009,2008,2007,2006,2005,2004,2003,2002,2001,2000,1999,1998,1997,1996,1995,1994,1993,1992,1991,1990,1989,1988,1987,1986,1985,1984,1983,1982,1981,1980,1979,1978,1977,1976,1975,1974,1973,1972,1971,1970,1969,1968,1967,1966,1965,1964,1963,1962
Cette statistique dans les autres pays:
AfghanistanAlbaniaAlgeriaAmerican SamoaAngolaAntigua and BarbudaArab WorldArgentinaArmeniaAustraliaAustriaAzerbaijanBahamas, TheBahrainBangladeshBarbadosBelarusBelgiumBelizeBeninBermudaBhutanBoliviaBosnia and HerzegovinaBotswanaBrazilBritish Virgin IslandsBrunei DarussalamBulgariaBurkina FasoBurundiCabo VerdeCambodiaCameroonCanadaCaribbean small statesCayman IslandsCentral African RepublicCentral Europe and the BalticsChadChileChinaColombiaComorosCongo, Dem. Rep.Congo, Rep.Costa RicaCote d'IvoireCroatiaCubaCyprusCzech RepublicDenmarkDjiboutiDominicaDominican RepublicEarly-demographic dividendEast Asia & PacificEast Asia & Pacific (excluding high income)East Asia & Pacific (IDA & IBRD countries)EcuadorEgypt, Arab Rep.El SalvadorEquatorial GuineaEritreaEstoniaEthiopiaEuro areaEurope & Central AsiaEurope & Central Asia (excluding high income)Europe & Central Asia (IDA & IBRD countries)European UnionFaroe IslandsFijiFinlandFragile and conflict affected situationsFranceFrench PolynesiaGabonGambia, TheGeorgiaGermanyGhanaGreeceGreenlandGrenadaGuamGuatemalaGuineaGuinea-BissauGuyanaHaitiHeavily indebted poor countries (HIPC)High incomeHondurasHong Kong SAR, ChinaHungaryIBRD onlyIcelandIDA & IBRD totalIDA blendIDA onlyIDA totalIndiaIndonesiaIran, Islamic Rep.IraqIrelandIsraelItalyJamaicaJapanJordanKazakhstanKenyaKiribatiKorea, Dem. People’s Rep.Korea, Rep.KuwaitKyrgyz RepublicLao PDRLate-demographic dividendLatin America & Caribbean Latin America & Caribbean (excluding high income)Latin America & the Caribbean (IDA & IBRD countries)LatviaLeast developed countries: UN classificationLebanonLesothoLiberiaLibyaLiechtensteinLithuaniaLow & middle incomeLow incomeLower middle incomeLuxembourgMacao SAR, ChinaMacedonia, FYRMadagascarMalawiMalaysiaMaldivesMaliMaltaMauritaniaMauritiusMexicoMicronesia, Fed. Sts.Middle East & North AfricaMiddle East & North Africa (excluding high income)Middle East & North Africa (IDA & IBRD countries)Middle incomeMoldovaMongoliaMontenegroMoroccoMozambiqueMyanmarNamibiaNauruNepalNetherlandsNew CaledoniaNew ZealandNicaraguaNigerNigeriaNorth AmericaNorwayOECD membersOmanOther small statesPacific island small statesPakistanPanamaPapua New GuineaParaguayPeruPhilippinesPolandPortugalPost-demographic dividendPre-demographic dividendPuerto RicoQatarRomaniaRussian FederationRwandaSamoaSao Tome and PrincipeSaudi ArabiaSenegalSerbiaSeychellesSierra LeoneSingaporeSlovak RepublicSloveniaSmall statesSolomon IslandsSomaliaSouth AfricaSouth AsiaSouth Asia (IDA & IBRD)SpainSri LankaSt. Kitts and NevisSt. LuciaSt. Vincent and the GrenadinesSub-Saharan Africa Sub-Saharan Africa (excluding high income)Sub-Saharan Africa (IDA & IBRD countries)SudanSurinameSwazilandSwedenSwitzerlandSyrian Arab RepublicTajikistanTanzaniaThailandTimor-LesteTogoTongaTrinidad and TobagoTunisiaTurkeyTurkmenistanTuvaluUgandaUkraineUnited Arab EmiratesUnited KingdomUnited StatesUpper middle incomeUruguayUzbekistanVanuatuVenezuela, RBVietnamVirgin Islands (U.S.)West Bank and GazaWorldYemen, Rep.ZambiaZimbabwe La ligne de temps
Cette échelle de temps montre un graphique de 1962 année à 2014 année East Asia & Pacific (IDA & IBRD countries). Les données jusqu'à 1961 année ne sont pas présentés. Quantité d'observations actuelles selon dates: 53.
Source (désignation):
Les indicateurs du développement mondiale
Source (organisation):
Food and Agriculture Organization, electronic files and web site.
Catégories:
Agriculture & Rural Development
Dernière mise à jour
23 avr. 2017
Les indicateurs de changement de valeurs selon les années
Minimum:
6.889
1 janv. 1962
Maximum:
128.501
1 janv. 2014
Pour la date d''observation
Valeur
Changement absolu
Le changement par rapport à la valeur précédente
1 janv. 1962
6.889
+6.889
0.0%
1 janv. 1963
7.445
+0.556
8.07%
1 janv. 1964
8.972
+1.527
20.51%
1 janv. 1965
10.297
+1.325
14.76%
1 janv. 1966
11.22
+0.923
8.96%
1 janv. 1967
11.929
+0.71
6.32%
1 janv. 1968
12.372
+0.442
3.71%
1 janv. 1969
12.453
+0.081
0.65%
1 janv. 1970
12.497
+0.045
0.36%
1 janv. 1971
12.62
+0.123
0.98%
1 janv. 1972
13.687
+1.067
8.45%
1 janv. 1973
14.649
+0.962
7.03%
1 janv. 1974
15.066
+0.417
2.85%
1 janv. 1975
15.383
+0.317
2.1%
1 janv. 1976
15.731
+0.348
2.26%
1 janv. 1977
15.765
+0.034
0.21%
1 janv. 1978
16.005
+0.241
1.53%
1 janv. 1979
17.243
+1.238
7.73%
1 janv. 1980
19.428
+2.185
12.67%
1 janv. 1981
21.28
+1.852
9.53%
1 janv. 1982
22.254
+0.974
4.58%
1 janv. 1983
23.571
+1.317
5.92%
1 janv. 1984
24.702
+1.132
4.8%
1 janv. 1985
27.81
+3.107
12.58%
1 janv. 1986
30.085
+2.275
8.18%
1 janv. 1987
31.744
+1.659
5.52%
1 janv. 1988
34.357
+2.613
8.23%
1 janv. 1989
37.647
+3.29
9.58%
1 janv. 1990
39.681
+2.034
5.4%
1 janv. 1991
42.645
+2.963
7.47%
1 janv. 1992
46.835
+4.19
9.83%
1 janv. 1993
50.731
+3.896
8.32%
1 janv. 1994
55.383
+4.651
9.17%
1 janv. 1995
61.185
+5.802
10.48%
1 janv. 1996
66.064
+4.879
7.97%
1 janv. 1997
69.487
+3.423
5.18%
1 janv. 1998
71.809
+2.322
3.34%
1 janv. 1999
76.312
+4.503
6.27%
1 janv. 2000
78.768
+2.456
3.22%
1 janv. 2001
83.281
+4.514
5.73%
1 janv. 2002
84.81
+1.528
1.84%
1 janv. 2003
88.046
+3.236
3.82%
1 janv. 2004
92.899
+4.853
5.51%
1 janv. 2005
95.739
+2.84
3.06%
1 janv. 2006
100.07
+4.331
4.52%
1 janv. 2007
104.191
+4.121
4.12%
1 janv. 2008
108.269
+4.079
3.91%
1 janv. 2009
112.488
+4.218
3.9%
1 janv. 2010
116.858
+4.371
3.89%
1 janv. 2011
120.353
+3.494
2.99%
1 janv. 2012
121.714
+1.362
1.13%
1 janv. 2013
126.58
+4.866
4.0%
1 janv. 2014
128.501
+1.921
1.52%
Classement des pays selon les statistiques actuelles par années


Commentaires: