29
/fr/
fr
AIzaSyAYiBZKx7MnpbEhh9jyipgxe19OcubqV5w
April 1, 2024
286351
Zambia
ZMB
true
2
1
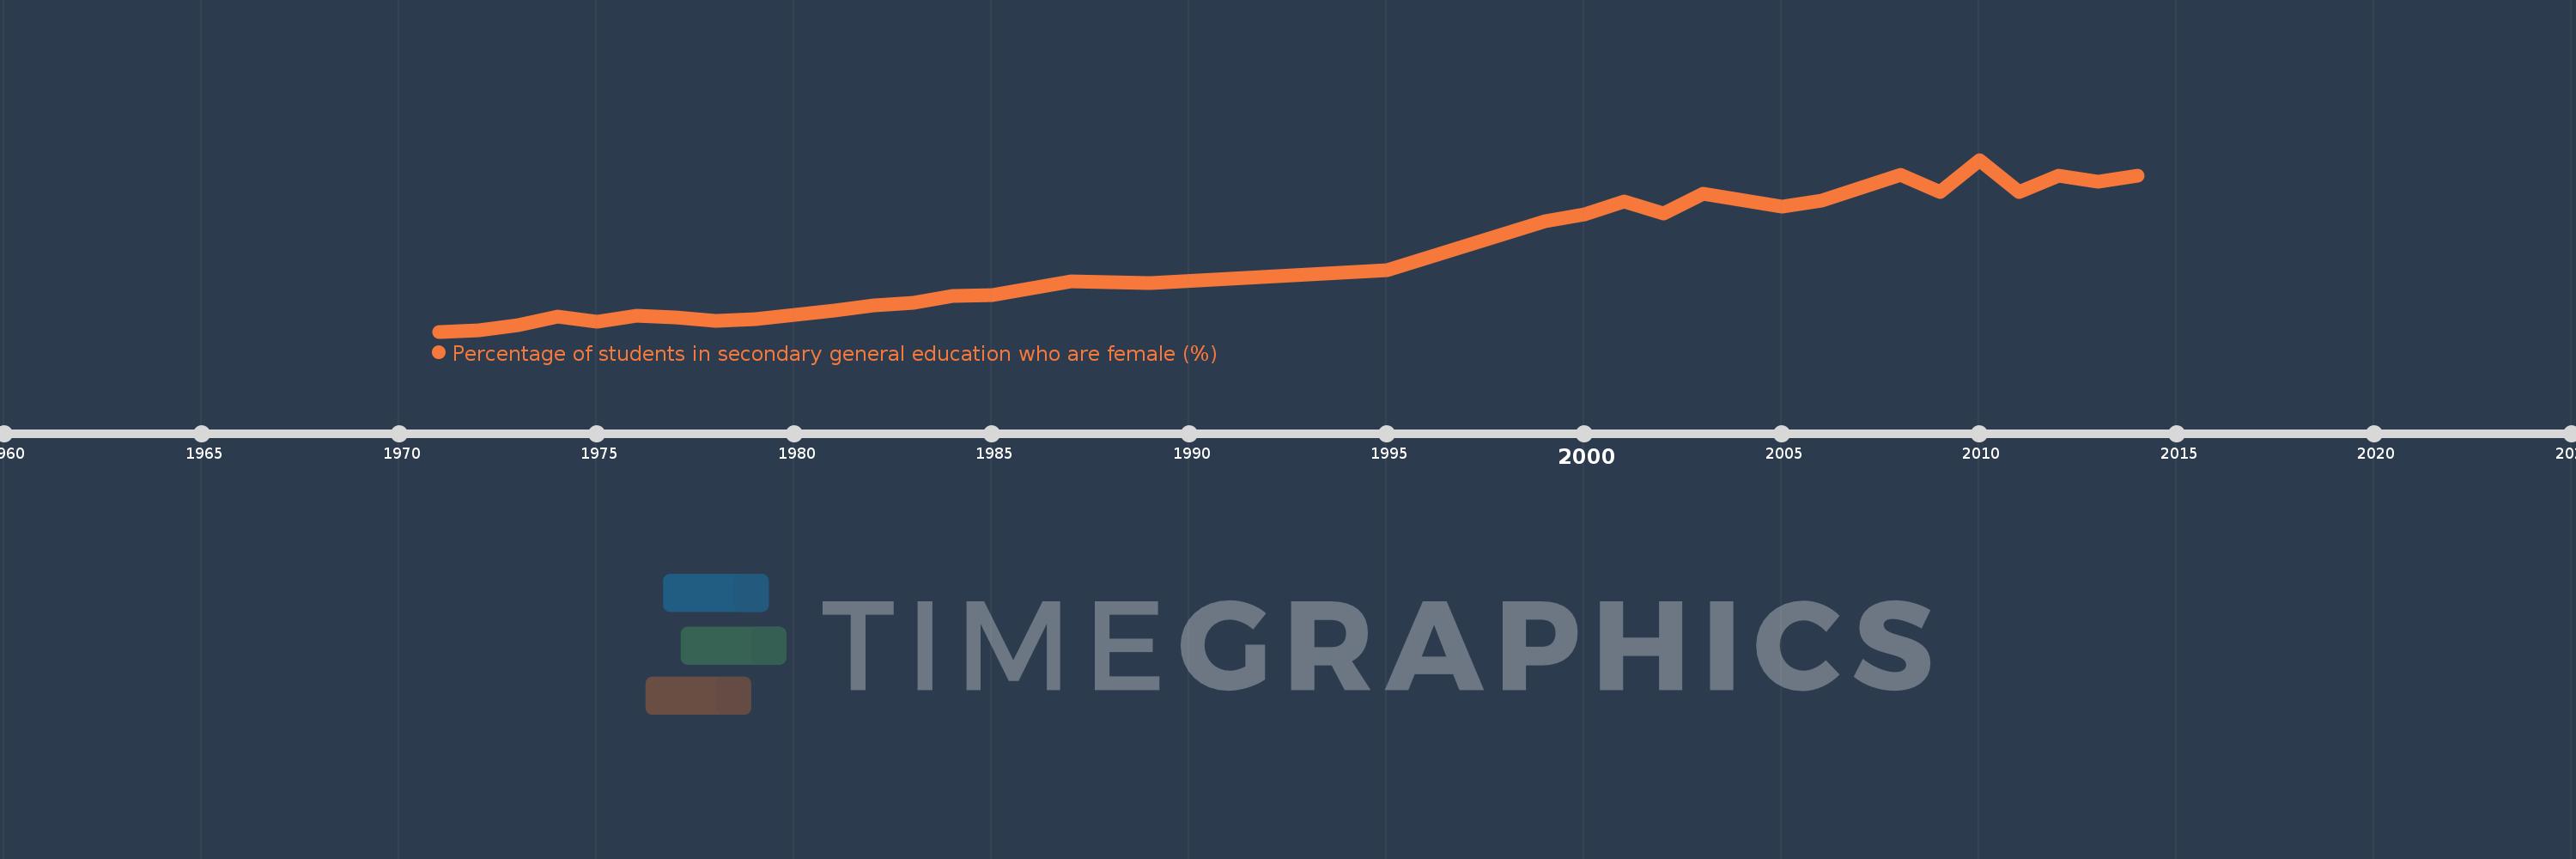
Percentage of students in secondary general education who are female (%)
2014,2013,2012,2011,2010,2009,2008,2006,2005,2003,2002,2001,2000,1999,1995,1989,1987,1986,1985,1984,1983,1982,1981,1980,1979,1978,1977,1976,1975,1974,1973,1972,1971
Cette statistique dans les autres pays:
AfghanistanAlbaniaAlgeriaAndorraAngolaAntigua and BarbudaArab WorldArgentinaArmeniaArubaAustraliaAustriaAzerbaijanBahamas, TheBahrainBangladeshBarbadosBelarusBelgiumBelizeBeninBermudaBhutanBoliviaBosnia and HerzegovinaBotswanaBrazilBritish Virgin IslandsBrunei DarussalamBulgariaBurkina FasoBurundiCabo VerdeCambodiaCameroonCanadaCaribbean small statesCayman IslandsCentral African RepublicCentral Europe and the BalticsChadChileChinaColombiaComorosCongo, Dem. Rep.Congo, Rep.Costa RicaCote d'IvoireCroatiaCubaCuracaoCyprusCzech RepublicDenmarkDjiboutiDominicaDominican RepublicEarly-demographic dividendEast Asia & PacificEast Asia & Pacific (excluding high income)East Asia & Pacific (IDA & IBRD countries)EcuadorEgypt, Arab Rep.El SalvadorEquatorial GuineaEritreaEstoniaEthiopiaEuro areaEurope & Central AsiaEurope & Central Asia (excluding high income)Europe & Central Asia (IDA & IBRD countries)European UnionFijiFinlandFragile and conflict affected situationsFranceGabonGambia, TheGeorgiaGermanyGhanaGibraltarGreeceGrenadaGuatemalaGuineaGuinea-BissauGuyanaHaitiHeavily indebted poor countries (HIPC)High incomeHondurasHong Kong SAR, ChinaHungaryIBRD onlyIcelandIDA & IBRD totalIDA blendIDA onlyIDA totalIndiaIndonesiaIran, Islamic Rep.IraqIrelandIsraelItalyJamaicaJapanJordanKazakhstanKenyaKiribatiKorea, Dem. People’s Rep.Korea, Rep.KuwaitKyrgyz RepublicLao PDRLate-demographic dividendLatin America & Caribbean Latin America & Caribbean (excluding high income)Latin America & the Caribbean (IDA & IBRD countries)LatviaLeast developed countries: UN classificationLebanonLesothoLiberiaLibyaLiechtensteinLithuaniaLow & middle incomeLow incomeLower middle incomeLuxembourgMacao SAR, ChinaMacedonia, FYRMadagascarMalawiMalaysiaMaldivesMaliMaltaMarshall IslandsMauritaniaMauritiusMexicoMicronesia, Fed. Sts.Middle East & North AfricaMiddle East & North Africa (excluding high income)Middle East & North Africa (IDA & IBRD countries)Middle incomeMoldovaMonacoMongoliaMontenegroMoroccoMozambiqueMyanmarNamibiaNauruNepalNetherlandsNew ZealandNicaraguaNigerNigeriaNorth AmericaNorwayOECD membersOmanOther small statesPacific island small statesPakistanPalauPanamaPapua New GuineaParaguayPeruPhilippinesPolandPortugalPost-demographic dividendPre-demographic dividendPuerto RicoQatarRomaniaRussian FederationRwandaSamoaSan MarinoSao Tome and PrincipeSaudi ArabiaSenegalSerbiaSeychellesSierra LeoneSingaporeSint Maarten (Dutch part)Slovak RepublicSloveniaSmall statesSolomon IslandsSomaliaSouth AfricaSouth AsiaSouth Asia (IDA & IBRD)South SudanSpainSri LankaSt. Kitts and NevisSt. LuciaSt. Vincent and the GrenadinesSub-Saharan Africa Sub-Saharan Africa (excluding high income)Sub-Saharan Africa (IDA & IBRD countries)SudanSurinameSwazilandSwedenSwitzerlandSyrian Arab RepublicTajikistanTanzaniaThailandTimor-LesteTogoTongaTrinidad and TobagoTunisiaTurkeyTurkmenistanTurks and Caicos IslandsTuvaluUgandaUkraineUnited Arab EmiratesUnited KingdomUnited StatesUpper middle incomeUruguayUzbekistanVanuatuVenezuela, RBVietnamWest Bank and GazaWorldYemen, Rep.ZambiaZimbabwe La ligne de temps
Cette échelle de temps montre un graphique de 1971 année à 2014 année Zambia. Les données jusqu'à 1970 année ne sont pas présentés. Quantité d'observations actuelles selon dates: 33.
Source (désignation):
Les indicateurs du développement mondiale
Source (organisation):
UNESCO Institute for Statistics
Catégories:
Education, Gender
Dernière mise à jour
23 avr. 2017
Les indicateurs de changement de valeurs selon les années
Minimum:
32.907
1 janv. 1971
Maximum:
48.26
1 janv. 2010
Pour la date d''observation
Valeur
Changement absolu
Le changement par rapport à la valeur précédente
1 janv. 1971
32.907
+32.907
0.0%
1 janv. 1972
32.991
+0.084
0.26%
1 janv. 1973
33.485
+0.494
1.5%
1 janv. 1974
34.237
+0.753
2.25%
1 janv. 1975
33.757
-0.48
-1.4%
1 janv. 1976
34.314
+0.557
1.65%
1 janv. 1977
34.178
-0.136
-0.4%
1 janv. 1978
33.842
-0.336
-0.98%
1 janv. 1979
33.989
+0.147
0.43%
1 janv. 1980
34.419
+0.431
1.27%
1 janv. 1981
34.78
+0.361
1.05%
1 janv. 1982
35.267
+0.488
1.4%
1 janv. 1983
35.512
+0.244
0.69%
1 janv. 1984
36.061
+0.55
1.55%
1 janv. 1985
36.162
+0.101
0.28%
1 janv. 1986
36.78
+0.617
1.71%
1 janv. 1987
37.373
+0.593
1.61%
1 janv. 1989
37.276
-0.096
-0.26%
1 janv. 1995
38.361
+1.084
2.91%
1 janv. 1999
42.804
+4.444
11.58%
1 janv. 2000
43.399
+0.595
1.39%
1 janv. 2001
44.515
+1.116
2.57%
1 janv. 2002
43.45
-1.065
-2.39%
1 janv. 2003
45.195
+1.745
4.02%
1 janv. 2005
44.104
-1.091
-2.41%
1 janv. 2006
44.617
+0.514
1.16%
1 janv. 2008
46.889
+2.272
5.09%
1 janv. 2009
45.37
-1.52
-3.24%
1 janv. 2010
48.26
+2.89
6.37%
1 janv. 2011
45.35
-2.91
-6.03%
1 janv. 2012
46.818
+1.468
3.24%
1 janv. 2013
46.307
-0.511
-1.09%
1 janv. 2014
46.827
+0.52
1.12%
Classement des pays selon les statistiques actuelles par années


Commentaires: