29
/fr/
fr
AIzaSyAYiBZKx7MnpbEhh9jyipgxe19OcubqV5w
April 1, 2024
284412
Yemen, Rep.
YEM
true
2
1
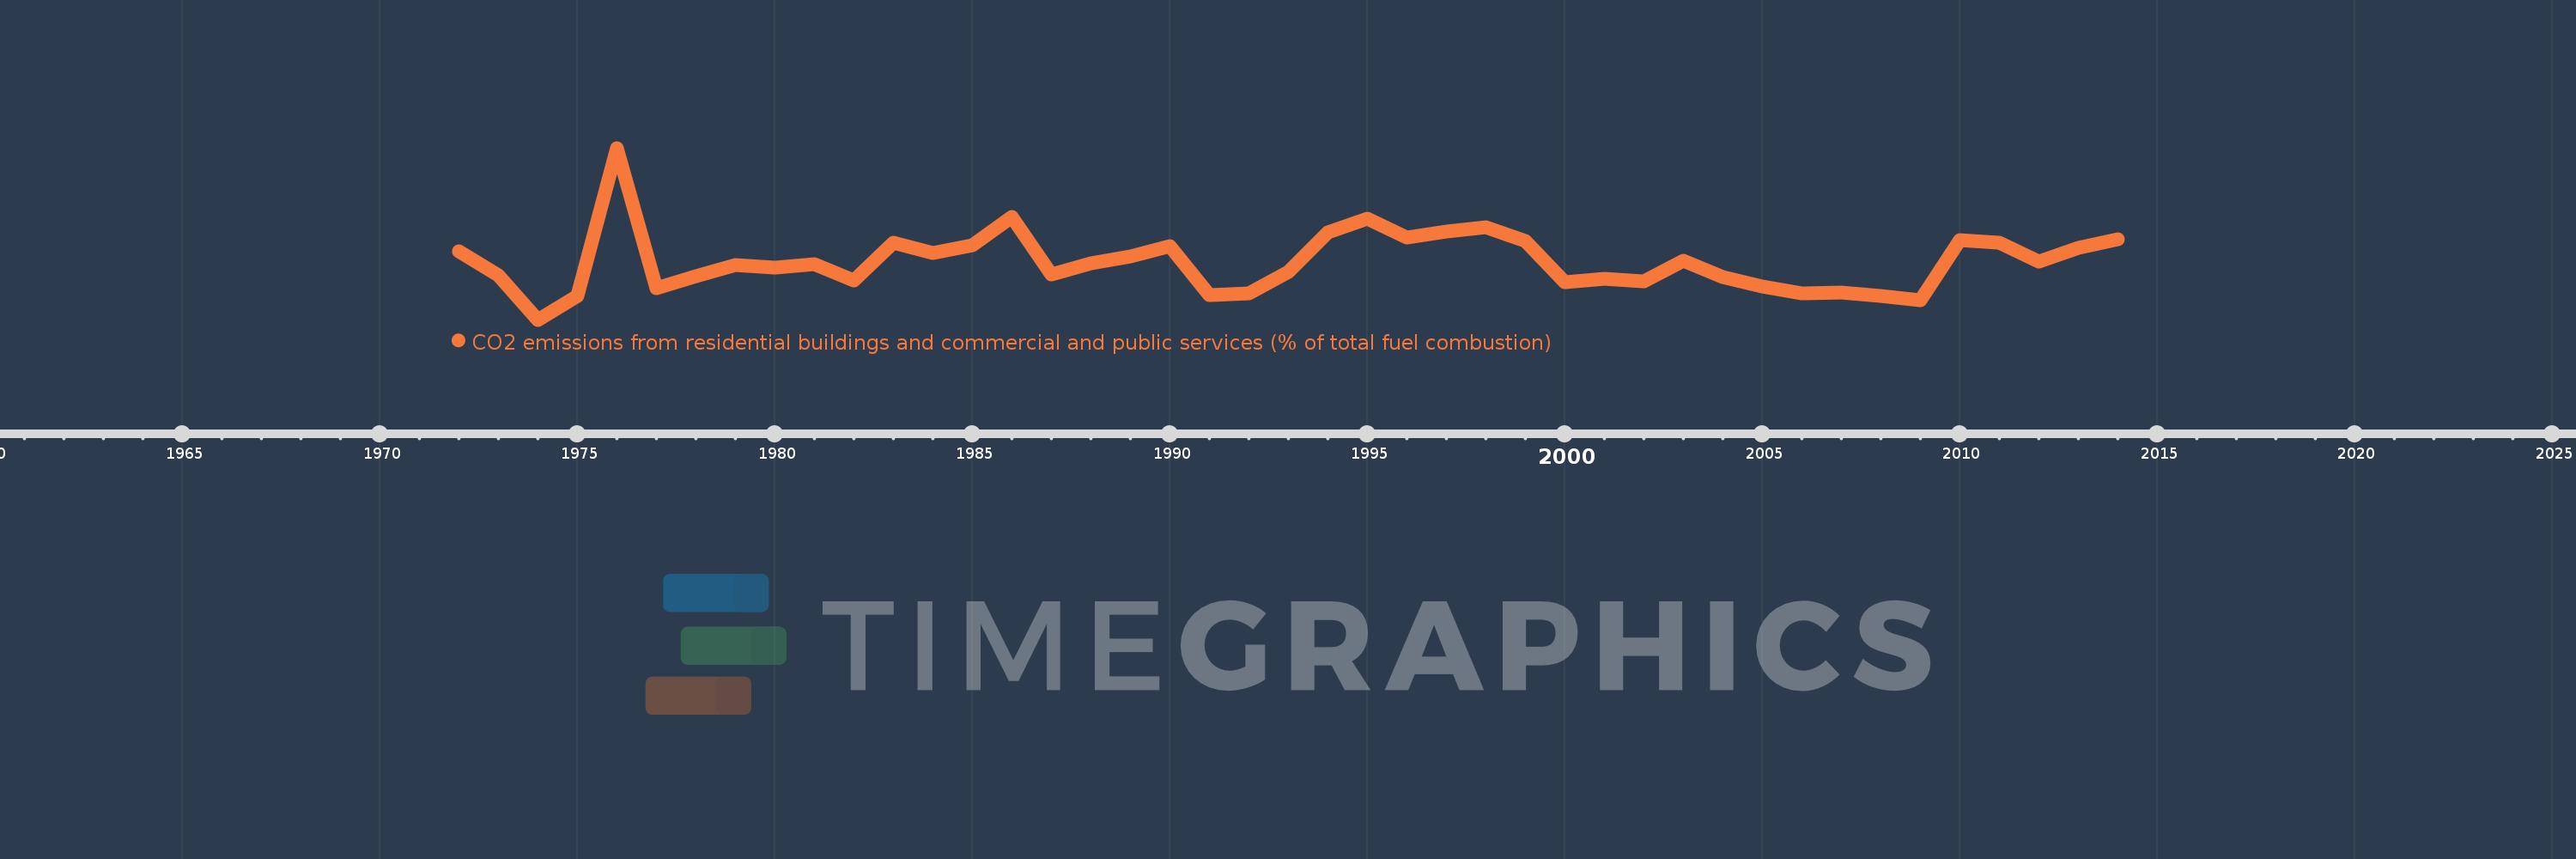
CO2 emissions from residential buildings and commercial and public services (% of total fuel combustion)
2014,2013,2012,2011,2010,2009,2008,2007,2006,2005,2004,2003,2002,2001,2000,1999,1998,1997,1996,1995,1994,1993,1992,1991,1990,1989,1988,1987,1986,1985,1984,1983,1982,1981,1980,1979,1978,1977,1976,1975,1974,1973,1972
Cette statistique dans les autres pays:
AlbaniaAlgeriaAngolaArab WorldArgentinaArmeniaAustraliaAustriaAzerbaijanBahrainBangladeshBelarusBelgiumBeninBoliviaBosnia and HerzegovinaBotswanaBrazilBrunei DarussalamBulgariaCambodiaCameroonCanadaCaribbean small statesCentral Europe and the BalticsChileChinaColombiaCongo, Dem. Rep.Congo, Rep.Costa RicaCote d'IvoireCroatiaCubaCuracaoCyprusCzech RepublicDenmarkDominican RepublicEarly-demographic dividendEast Asia & PacificEast Asia & Pacific (excluding high income)East Asia & Pacific (IDA & IBRD countries)EcuadorEgypt, Arab Rep.El SalvadorEritreaEstoniaEthiopiaEuro areaEurope & Central AsiaEurope & Central Asia (excluding high income)Europe & Central Asia (IDA & IBRD countries)European UnionFinlandFragile and conflict affected situationsFranceGabonGeorgiaGermanyGhanaGibraltarGreeceGuatemalaHaitiHeavily indebted poor countries (HIPC)High incomeHondurasHong Kong SAR, ChinaHungaryIBRD onlyIcelandIDA & IBRD totalIDA blendIDA onlyIDA totalIndiaIndonesiaIran, Islamic Rep.IraqIrelandIsraelItalyJamaicaJapanJordanKazakhstanKenyaKorea, Dem. People’s Rep.Korea, Rep.KosovoKuwaitKyrgyz RepublicLate-demographic dividendLatin America & Caribbean Latin America & Caribbean (excluding high income)Latin America & the Caribbean (IDA & IBRD countries)LatviaLeast developed countries: UN classificationLebanonLibyaLithuaniaLow & middle incomeLow incomeLower middle incomeLuxembourgMacedonia, FYRMalaysiaMaltaMauritiusMexicoMiddle East & North AfricaMiddle East & North Africa (excluding high income)Middle East & North Africa (IDA & IBRD countries)Middle incomeMoldovaMongoliaMontenegroMoroccoMozambiqueMyanmarNamibiaNepalNetherlandsNew ZealandNicaraguaNigerNigeriaNorth AmericaNorwayOECD membersOmanOther small statesPakistanPanamaParaguayPeruPhilippinesPolandPortugalPost-demographic dividendPre-demographic dividendQatarRomaniaRussian FederationSaudi ArabiaSenegalSerbiaSingaporeSlovak RepublicSloveniaSmall statesSouth AfricaSouth AsiaSouth Asia (IDA & IBRD)South SudanSpainSri LankaSub-Saharan Africa Sub-Saharan Africa (excluding high income)Sub-Saharan Africa (IDA & IBRD countries)SudanSwedenSwitzerlandSyrian Arab RepublicTajikistanTanzaniaThailandTogoTrinidad and TobagoTunisiaTurkeyTurkmenistanUkraineUnited Arab EmiratesUnited KingdomUnited StatesUpper middle incomeUruguayUzbekistanVenezuela, RBVietnamWorldYemen, Rep.ZambiaZimbabwe La ligne de temps
Cette échelle de temps montre un graphique de 1972 année à 2014 année Yemen, Rep.. Les données jusqu'à 1971 année ne sont pas présentés. Quantité d'observations actuelles selon dates: 43.
Source (désignation):
Les indicateurs du développement mondiale
Source (organisation):
IEA Statistics © OECD/IEA 2014 (http://www.iea.org/stats/index.asp), subject to https://www.iea.org/t&c/termsandconditions/
Catégories:
Environment
Dernière mise à jour
23 avr. 2017
Les indicateurs de changement de valeurs selon les années
Maximum:
21.714
1 janv. 1976
Pour la date d''observation
Valeur
Changement absolu
Le changement par rapport à la valeur précédente
1 janv. 1972
14.167
+14.167
0.0%
1 janv. 1973
12.414
-1.753
-12.37%
1 janv. 1974
9.14
-3.274
-26.37%
1 janv. 1975
10.87
+1.73
18.93%
1 janv. 1976
21.714
+10.845
99.77%
1 janv. 1977
11.468
-10.246
-47.19%
1 janv. 1978
12.329
+0.861
7.51%
1 janv. 1979
13.115
+0.786
6.38%
1 janv. 1980
12.928
-0.187
-1.43%
1 janv. 1981
13.218
+0.291
2.25%
1 janv. 1982
12.0
-1.218
-9.22%
1 janv. 1983
14.787
+2.787
23.22%
1 janv. 1984
14.027
-0.76
-5.14%
1 janv. 1985
14.602
+0.575
4.1%
1 janv. 1986
16.667
+2.065
14.14%
1 janv. 1987
12.451
-4.215
-25.29%
1 janv. 1988
13.298
+0.847
6.8%
1 janv. 1989
13.793
+0.495
3.72%
1 janv. 1990
14.511
+0.718
5.21%
1 janv. 1991
10.952
-3.559
-24.52%
1 janv. 1992
11.057
+0.104
0.95%
1 janv. 1993
12.614
+1.557
14.08%
1 janv. 1994
15.533
+2.919
23.14%
1 janv. 1995
16.564
+1.032
6.64%
1 janv. 1996
15.164
-1.4
-8.45%
1 janv. 1997
15.615
+0.451
2.97%
1 janv. 1998
15.927
+0.311
1.99%
1 janv. 1999
14.92
-1.007
-6.32%
1 janv. 2000
11.905
-3.015
-20.21%
1 janv. 2001
12.144
+0.239
2.01%
1 janv. 2002
11.923
-0.221
-1.82%
1 janv. 2003
13.462
+1.539
12.91%
1 janv. 2004
12.292
-1.169
-8.69%
1 janv. 2005
11.547
-0.745
-6.06%
1 janv. 2006
11.099
-0.448
-3.88%
1 janv. 2007
11.117
+0.018
0.16%
1 janv. 2008
10.9
-0.217
-1.95%
1 janv. 2009
10.588
-0.312
-2.86%
1 janv. 2010
14.985
+4.397
41.53%
1 janv. 2011
14.75
-0.235
-1.57%
1 janv. 2012
13.424
-1.327
-9.0%
1 janv. 2013
14.409
+0.985
7.34%
1 janv. 2014
15.05
+0.641
4.45%
Classement des pays selon les statistiques actuelles par années


Commentaires: