29
/fr/
fr
AIzaSyAYiBZKx7MnpbEhh9jyipgxe19OcubqV5w
April 1, 2024
276890
United States
USA
true
2
1
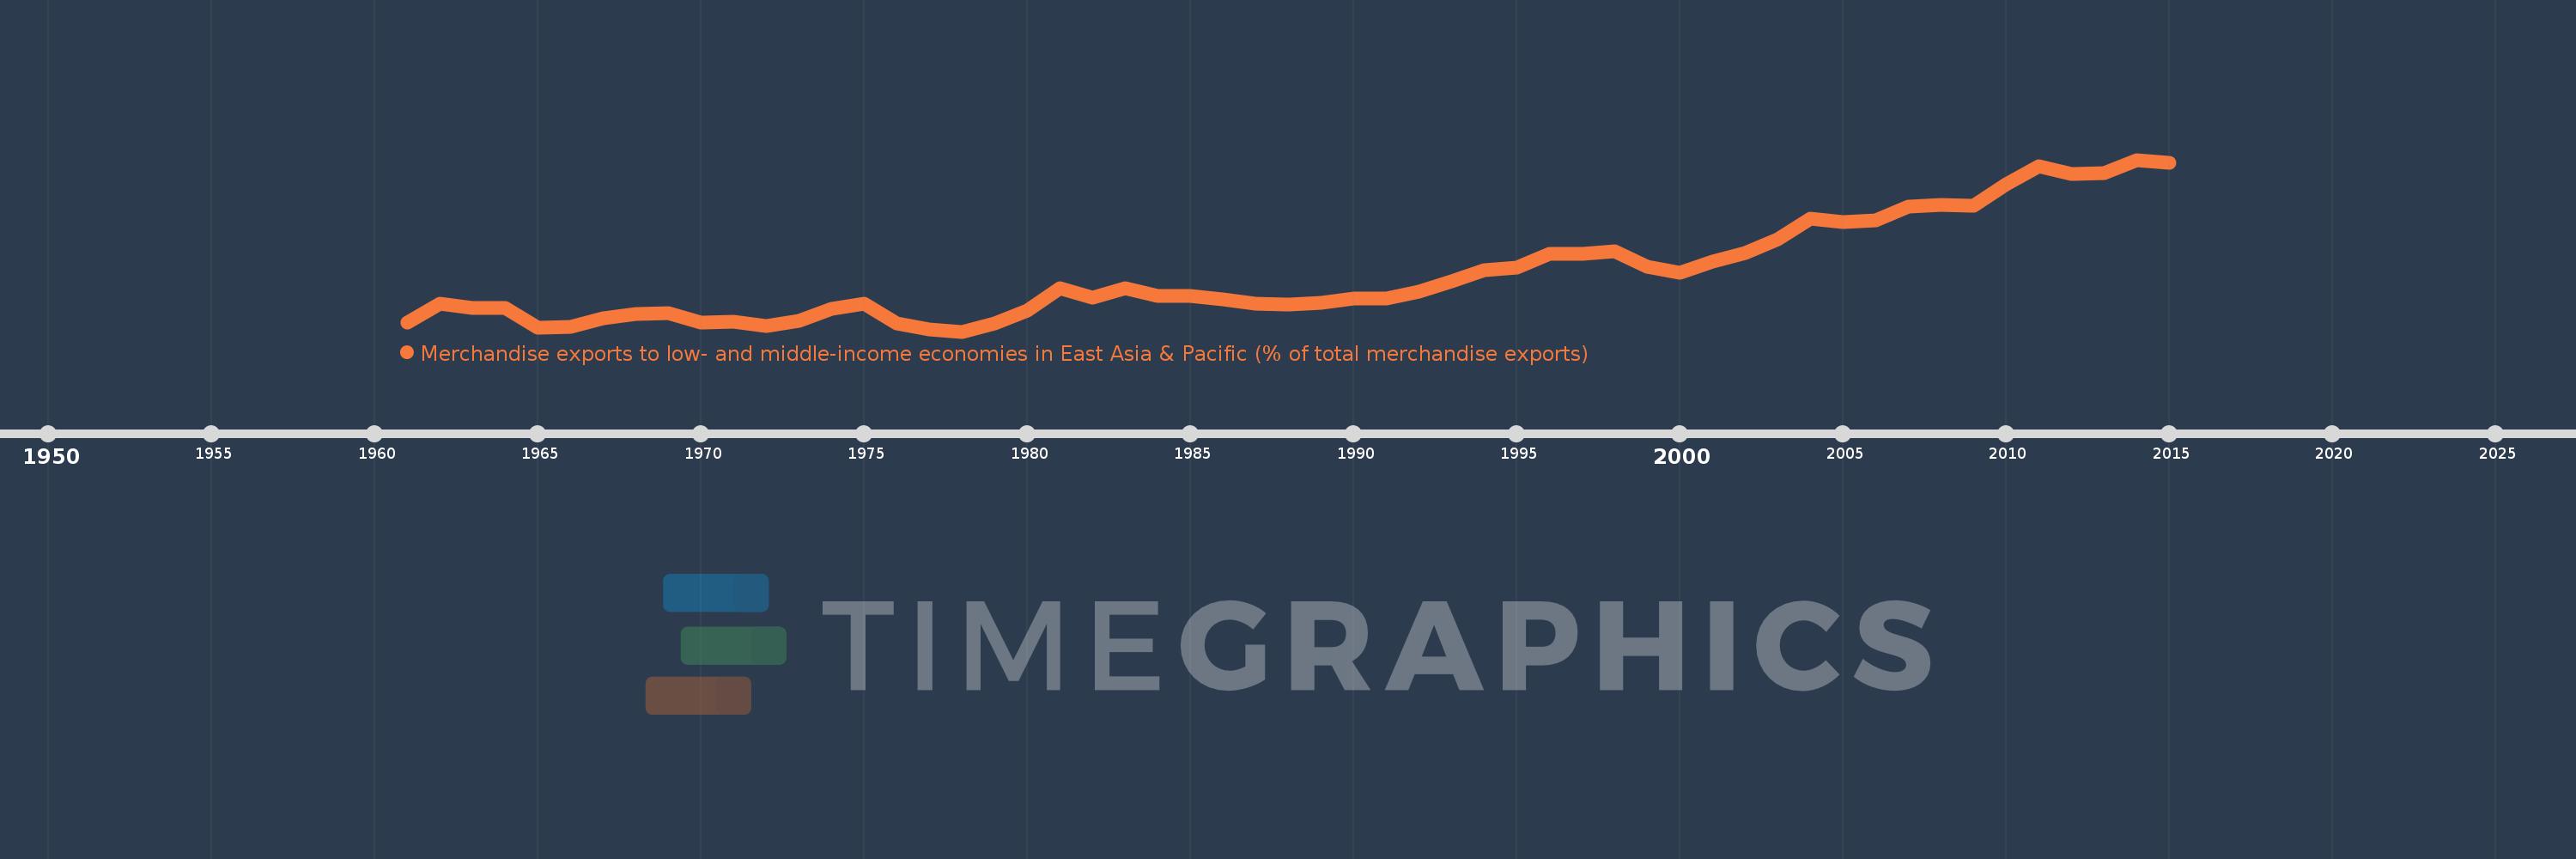
Merchandise exports to low- and middle-income economies in East Asia & Pacific (% of total merchandise exports)
2015,2014,2013,2012,2011,2010,2009,2008,2007,2006,2005,2004,2003,2002,2001,2000,1999,1998,1997,1996,1995,1994,1993,1992,1991,1990,1989,1988,1987,1986,1985,1984,1983,1982,1981,1980,1979,1978,1977,1976,1975,1974,1973,1972,1971,1970,1969,1968,1967,1966,1965,1964,1963,1962,1961
Cette statistique dans les autres pays:
AfghanistanAlbaniaAlgeriaArab WorldArgentinaAustraliaAustriaAzerbaijanBahamas, TheBahrainBangladeshBarbadosBelarusBelgiumBermudaBrazilBrunei DarussalamBulgariaCabo VerdeCambodiaCameroonCanadaCaribbean small statesCentral Europe and the BalticsChileChinaColombiaCosta RicaCote d'IvoireCroatiaCubaCyprusCzech RepublicDenmarkDominicaDominican RepublicEarly-demographic dividendEast Asia & PacificEast Asia & Pacific (excluding high income)East Asia & Pacific (IDA & IBRD countries)EcuadorEgypt, Arab Rep.El SalvadorEstoniaEthiopiaEuro areaEurope & Central AsiaEurope & Central Asia (excluding high income)Europe & Central Asia (IDA & IBRD countries)European UnionFijiFinlandFragile and conflict affected situationsFranceGermanyGhanaGreeceGuatemalaGuyanaHeavily indebted poor countries (HIPC)High incomeHondurasHong Kong SAR, ChinaHungaryIBRD onlyIcelandIDA & IBRD totalIDA blendIDA onlyIDA totalIndiaIndonesiaIran, Islamic Rep.IraqIrelandIsraelItalyJamaicaJapanJordanKazakhstanKenyaKorea, Dem. People’s Rep.Korea, Rep.KuwaitLate-demographic dividendLatin America & Caribbean Latin America & Caribbean (excluding high income)Latin America & the Caribbean (IDA & IBRD countries)LatviaLeast developed countries: UN classificationLebanonLithuaniaLow & middle incomeLow incomeLower middle incomeLuxembourgMacao SAR, ChinaMacedonia, FYRMadagascarMalaysiaMaltaMauritiusMexicoMiddle East & North AfricaMiddle East & North Africa (excluding high income)Middle East & North Africa (IDA & IBRD countries)Middle incomeMoldovaMontenegroMoroccoMozambiqueMyanmarNetherlandsNew CaledoniaNew ZealandNigeriaNorth AmericaNorwayOECD membersOmanOther small statesPacific island small statesPakistanPapua New GuineaParaguayPeruPhilippinesPolandPortugalPost-demographic dividendPre-demographic dividendQatarRomaniaRussian FederationSaudi ArabiaSenegalSerbiaSingaporeSlovak RepublicSloveniaSmall statesSolomon IslandsSomaliaSouth AfricaSouth AsiaSouth Asia (IDA & IBRD)SpainSri LankaSt. LuciaSub-Saharan Africa Sub-Saharan Africa (excluding high income)Sub-Saharan Africa (IDA & IBRD countries)SurinameSwedenSwitzerlandSyrian Arab RepublicTanzaniaThailandTogoTongaTrinidad and TobagoTunisiaTurkeyUgandaUkraineUnited Arab EmiratesUnited KingdomUnited StatesUpper middle incomeVenezuela, RBVietnamWorldYemen, Rep.ZambiaZimbabwe La ligne de temps
Cette échelle de temps montre un graphique de 1961 année à 2015 année United States. Les données jusqu'à 1960 année ne sont pas présentés. Quantité d'observations actuelles selon dates: 55.
Source (désignation):
Les indicateurs du développement mondiale
Source (organisation):
World Bank staff estimates based data from International Monetary Fund's Direction of Trade database.
Catégories:
Private Sector, Trade
Dernière mise à jour
23 avr. 2017
Les indicateurs de changement de valeurs selon les années
Minimum:
2.403
1 janv. 1978
Maximum:
10.776
1 janv. 2014
Pour la date d''observation
Valeur
Changement absolu
Le changement par rapport à la valeur précédente
1 janv. 1961
2.854
+2.854
0.0%
1 janv. 1962
3.75
+0.896
31.42%
1 janv. 1963
3.544
-0.206
-5.51%
1 janv. 1964
3.57
+0.027
0.75%
1 janv. 1965
2.609
-0.961
-26.92%
1 janv. 1966
2.619
+0.01
0.39%
1 janv. 1967
3.059
+0.44
16.78%
1 janv. 1968
3.26
+0.201
6.58%
1 janv. 1969
3.295
+0.035
1.07%
1 janv. 1970
2.855
-0.44
-13.34%
1 janv. 1971
2.88
+0.025
0.88%
1 janv. 1972
2.678
-0.203
-7.04%
1 janv. 1973
2.941
+0.263
9.84%
1 janv. 1974
3.533
+0.593
20.15%
1 janv. 1975
3.78
+0.246
6.97%
1 janv. 1976
2.798
-0.982
-25.99%
1 janv. 1977
2.518
-0.279
-9.98%
1 janv. 1978
2.403
-0.116
-4.59%
1 janv. 1979
2.81
+0.407
16.95%
1 janv. 1980
3.426
+0.616
21.93%
1 janv. 1981
4.525
+1.098
32.05%
1 janv. 1982
4.073
-0.451
-9.98%
1 janv. 1983
4.509
+0.435
10.69%
1 janv. 1984
4.146
-0.362
-8.04%
1 janv. 1985
4.151
+0.004
0.1%
1 janv. 1986
3.98
-0.171
-4.11%
1 janv. 1987
3.762
-0.218
-5.48%
1 janv. 1988
3.715
-0.048
-1.26%
1 janv. 1989
3.802
+0.087
2.35%
1 janv. 1990
4.02
+0.218
5.74%
1 janv. 1991
4.004
-0.015
-0.38%
1 janv. 1992
4.339
+0.335
8.37%
1 janv. 1993
4.852
+0.513
11.82%
1 janv. 1994
5.417
+0.565
11.64%
1 janv. 1995
5.51
+0.093
1.71%
1 janv. 1996
6.182
+0.673
12.21%
1 janv. 1997
6.196
+0.013
0.22%
1 janv. 1998
6.322
+0.126
2.04%
1 janv. 1999
5.582
-0.74
-11.71%
1 janv. 2000
5.27
-0.311
-5.58%
1 janv. 2001
5.833
+0.562
10.67%
1 janv. 2002
6.214
+0.381
6.53%
1 janv. 2003
6.908
+0.694
11.18%
1 janv. 2004
7.901
+0.993
14.37%
1 janv. 2005
7.731
-0.17
-2.16%
1 janv. 2006
7.84
+0.109
1.41%
1 janv. 2007
8.483
+0.643
8.2%
1 janv. 2008
8.564
+0.082
0.96%
1 janv. 2009
8.54
-0.024
-0.28%
1 janv. 2010
9.592
+1.051
12.31%
1 janv. 2011
10.448
+0.856
8.93%
1 janv. 2012
10.104
-0.344
-3.29%
1 janv. 2013
10.127
+0.023
0.23%
1 janv. 2014
10.776
+0.649
6.41%
1 janv. 2015
10.612
-0.164
-1.52%
Classement des pays selon les statistiques actuelles par années


Commentaires: