29
/fr/
fr
AIzaSyAYiBZKx7MnpbEhh9jyipgxe19OcubqV5w
April 1, 2024
275974
United Kingdom
GBR
true
2
1
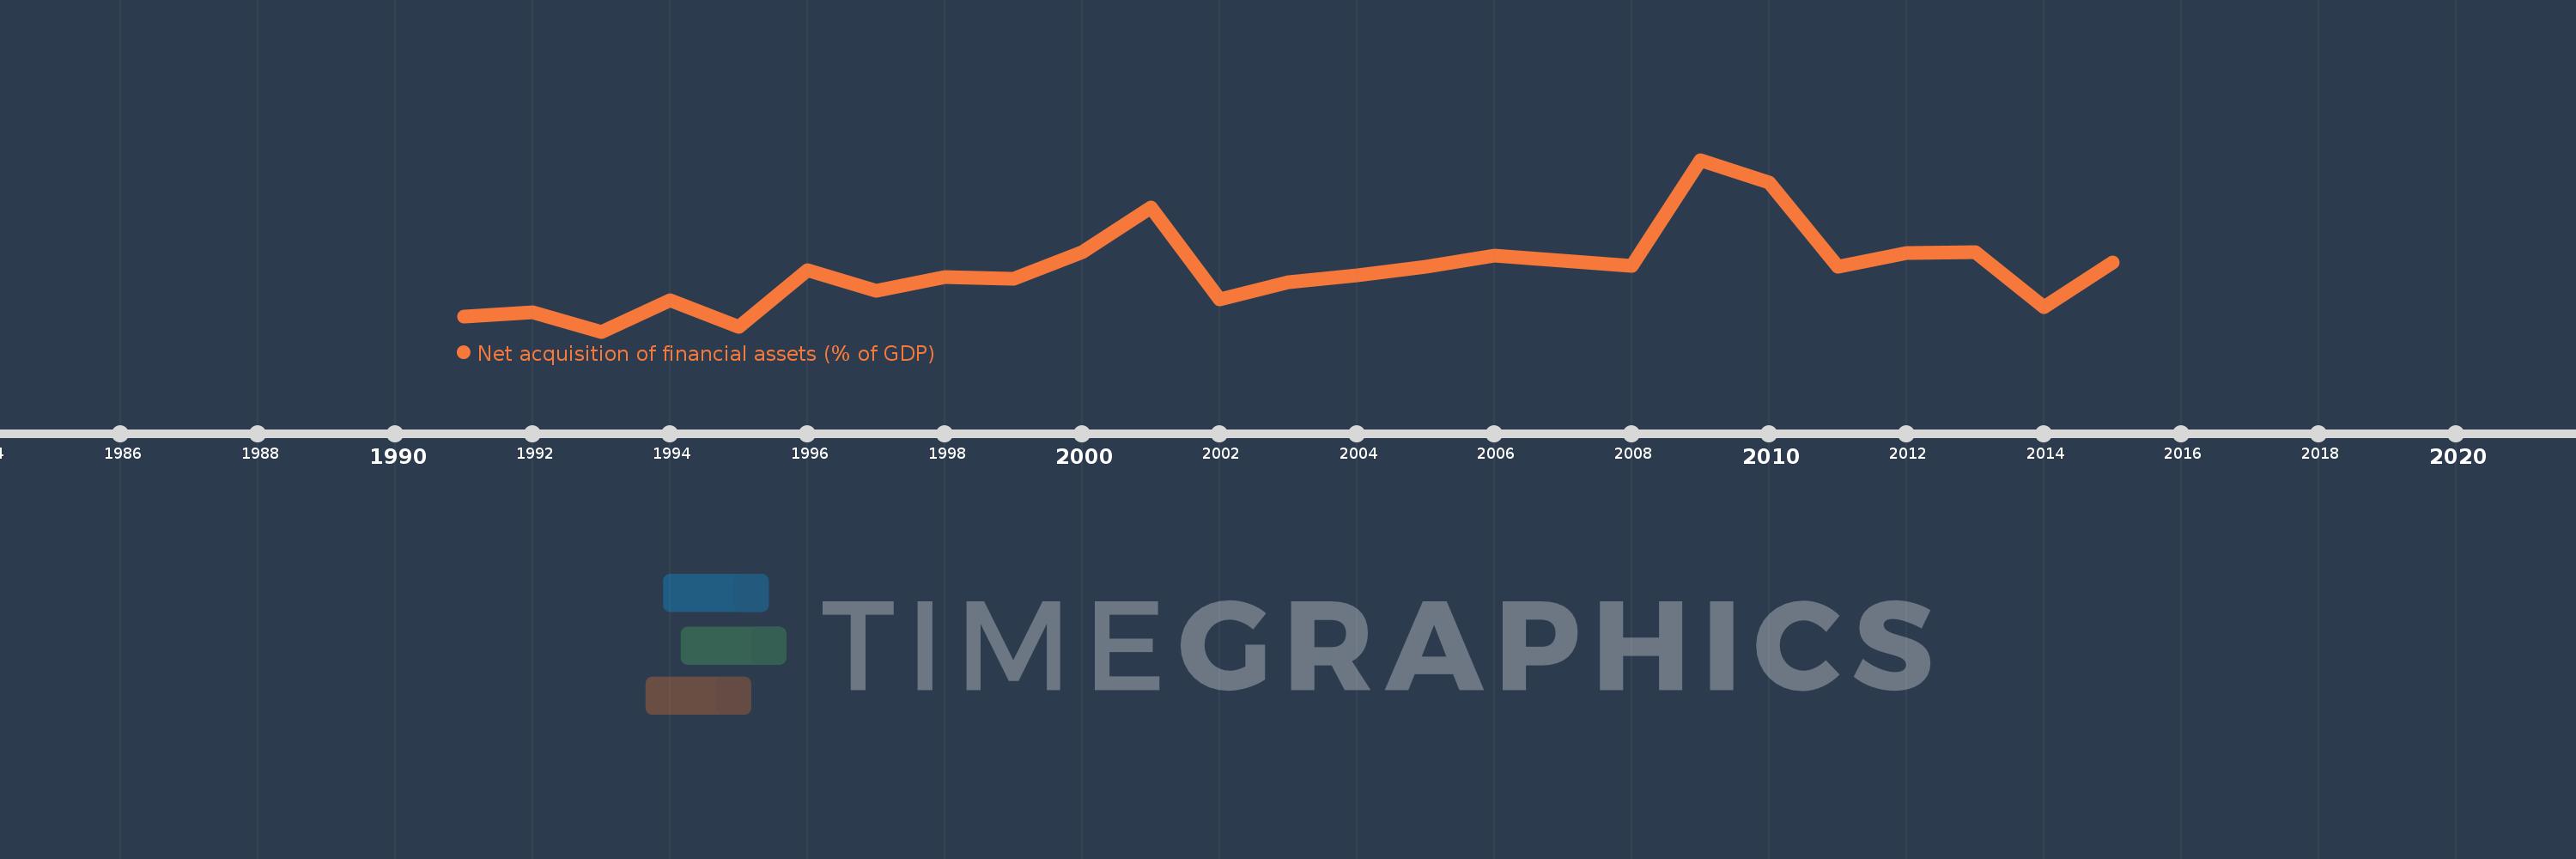
Net acquisition of financial assets (% of GDP)
2015,2014,2013,2012,2011,2010,2009,2008,2007,2006,2005,2004,2003,2002,2001,2000,1999,1998,1997,1996,1995,1994,1993,1992,1991
Cette statistique dans les autres pays:
La ligne de temps
Cette échelle de temps montre un graphique de 1991 année à 2015 année United Kingdom. Les données jusqu'à 1990 année ne sont pas présentés. Quantité d'observations actuelles selon dates: 25.
Source (désignation):
Les indicateurs du développement mondiale
Source (organisation):
International Monetary Fund, Government Finance Statistics Yearbook and data files.
Catégories:
Public Sector
Dernière mise à jour
23 avr. 2017
Les indicateurs de changement de valeurs selon les années
Minimum:
-2.38
1 janv. 1993
Pour la date d''observation
Valeur
Changement absolu
Le changement par rapport à la valeur précédente
1 janv. 1991
-1.752
-1.752
0.0%
1 janv. 1992
-1.577
+0.175
-9.98%
1 janv. 1993
-2.38
-0.803
50.92%
1 janv. 1994
-1.073
+1.307
-54.93%
1 janv. 1995
-2.18
-1.108
103.28%
1 janv. 1996
0.151
+2.332
-106.95%
1 janv. 1997
-0.711
-0.862
-569.53%
1 janv. 1998
-0.141
+0.57
-80.15%
1 janv. 1999
-0.211
-0.07
49.84%
1 janv. 2000
0.916
+1.127
-533.11%
1 janv. 2001
2.743
+1.827
199.44%
1 janv. 2002
-1.066
-3.809
-138.88%
1 janv. 2003
-0.346
+0.72
-67.53%
1 janv. 2004
-0.058
+0.288
-83.27%
1 janv. 2005
0.294
+0.352
-606.89%
1 janv. 2006
0.74
+0.446
151.85%
1 janv. 2007
0.532
-0.207
-28.04%
1 janv. 2008
0.342
-0.19
-35.7%
1 janv. 2009
4.71
+4.367
1.28 milles%
1 janv. 2010
3.784
-0.925
-19.65%
1 janv. 2011
0.294
-3.491
-92.24%
1 janv. 2012
0.877
+0.584
198.77%
1 janv. 2013
0.887
+0.01
1.16%
1 janv. 2014
-1.359
-2.247
-253.15%
1 janv. 2015
0.481
+1.84
-135.36%
Classement des pays selon les statistiques actuelles par années


Commentaires: