29
/fr/
fr
AIzaSyAYiBZKx7MnpbEhh9jyipgxe19OcubqV5w
April 1, 2024
267971
Tunisia
TUN
true
2
1
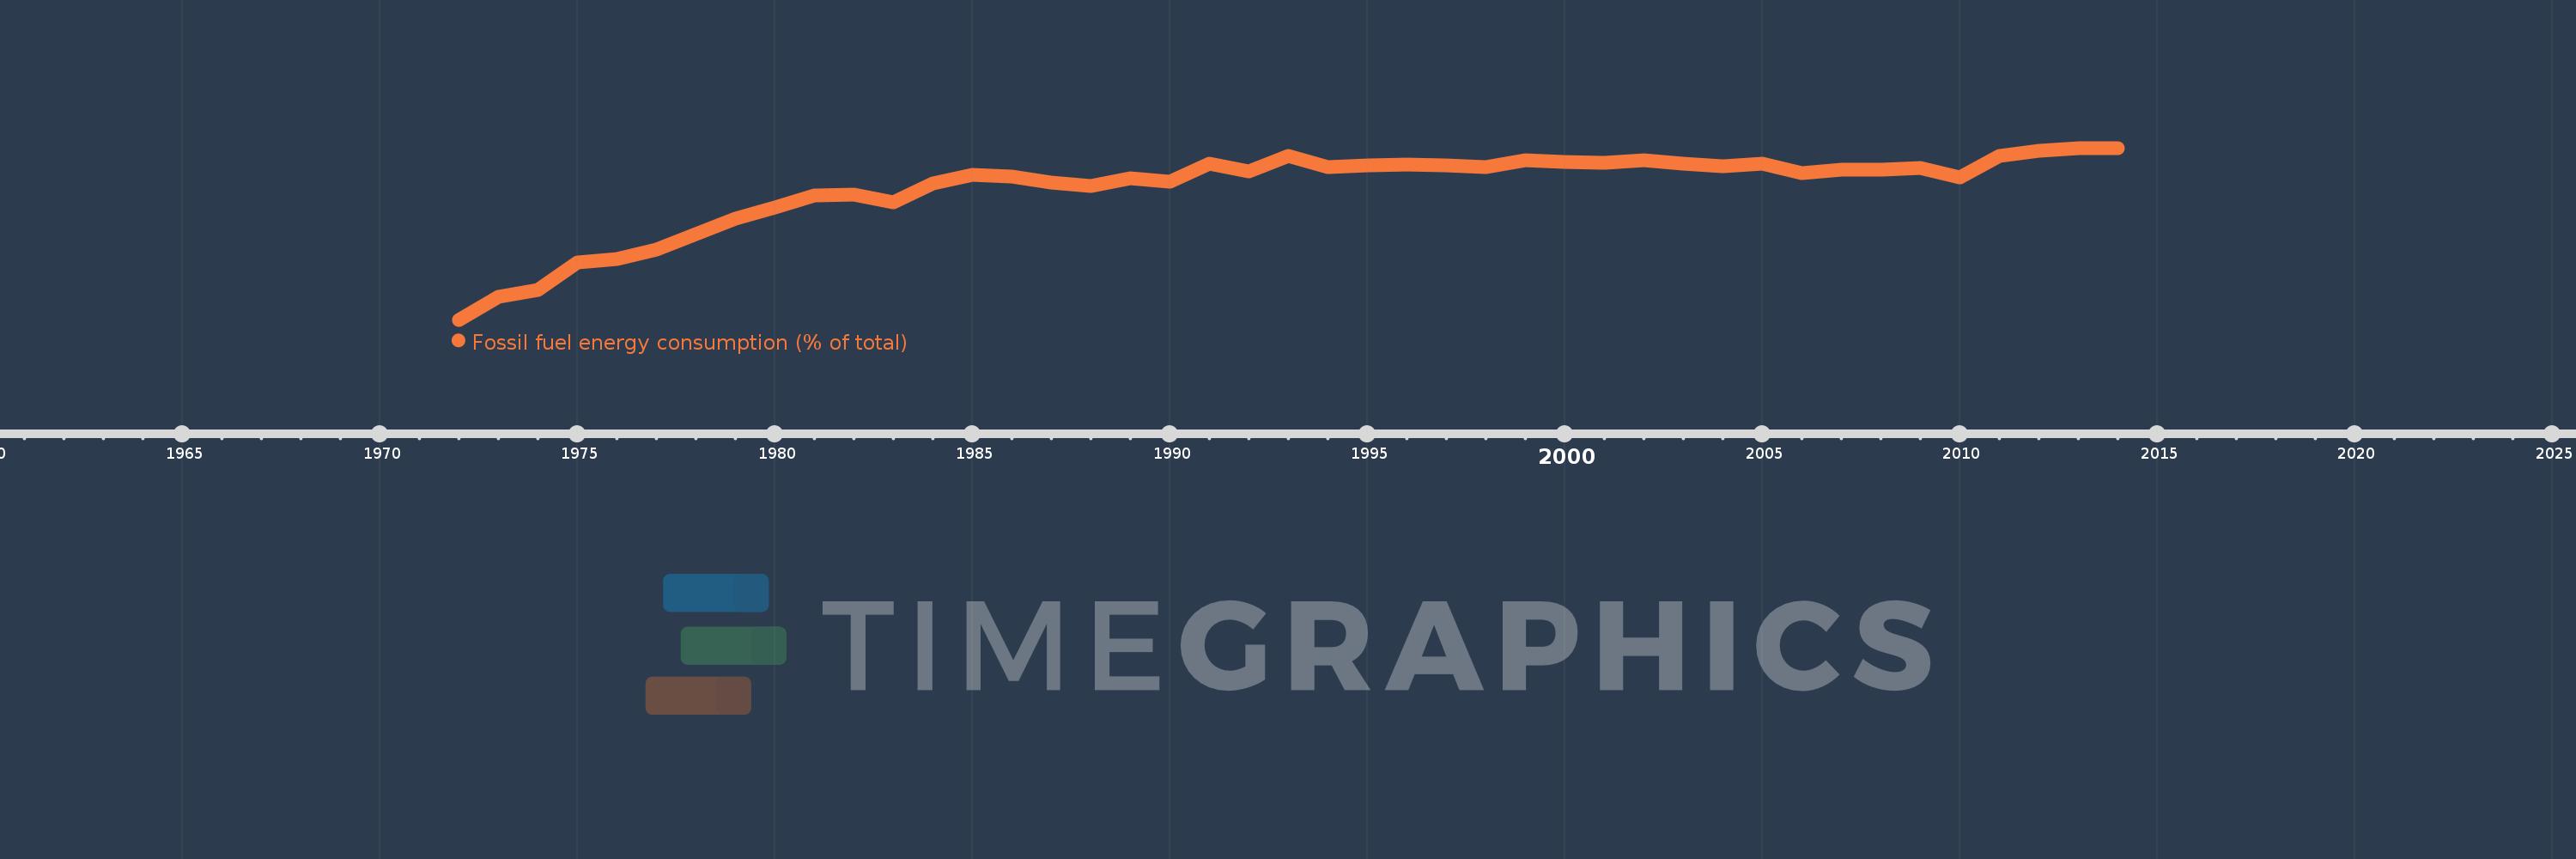
Fossil fuel energy consumption (% of total)
2014,2013,2012,2011,2010,2009,2008,2007,2006,2005,2004,2003,2002,2001,2000,1999,1998,1997,1996,1995,1994,1993,1992,1991,1990,1989,1988,1987,1986,1985,1984,1983,1982,1981,1980,1979,1978,1977,1976,1975,1974,1973,1972
Cette statistique dans les autres pays:
AlbaniaAlgeriaAngolaAntigua and BarbudaArab WorldArgentinaArmeniaAustraliaAustriaAzerbaijanBahamas, TheBahrainBangladeshBarbadosBelarusBelgiumBelizeBeninBhutanBoliviaBosnia and HerzegovinaBotswanaBrazilBrunei DarussalamBulgariaCabo VerdeCambodiaCameroonCanadaCaribbean small statesCentral Europe and the BalticsChileChinaColombiaComorosCongo, Dem. Rep.Congo, Rep.Costa RicaCote d'IvoireCroatiaCubaCuracaoCyprusCzech RepublicDenmarkDjiboutiDominicaDominican RepublicEarly-demographic dividendEast Asia & PacificEast Asia & Pacific (excluding high income)East Asia & Pacific (IDA & IBRD countries)EcuadorEgypt, Arab Rep.El SalvadorEquatorial GuineaEritreaEstoniaEthiopiaEuro areaEurope & Central AsiaEurope & Central Asia (excluding high income)Europe & Central Asia (IDA & IBRD countries)European UnionFijiFinlandFragile and conflict affected situationsFranceGabonGambia, TheGeorgiaGermanyGhanaGibraltarGreeceGrenadaGuatemalaGuinea-BissauGuyanaHaitiHeavily indebted poor countries (HIPC)High incomeHondurasHong Kong SAR, ChinaHungaryIBRD onlyIcelandIDA & IBRD totalIDA blendIDA onlyIDA totalIndiaIndonesiaIran, Islamic Rep.IraqIrelandIsraelItalyJamaicaJapanJordanKazakhstanKenyaKiribatiKorea, Dem. People’s Rep.Korea, Rep.KosovoKuwaitKyrgyz RepublicLate-demographic dividendLatin America & Caribbean Latin America & Caribbean (excluding high income)Latin America & the Caribbean (IDA & IBRD countries)LatviaLeast developed countries: UN classificationLebanonLesothoLibyaLithuaniaLow & middle incomeLow incomeLower middle incomeLuxembourgMacedonia, FYRMalaysiaMaldivesMaltaMarshall IslandsMauritiusMexicoMiddle East & North AfricaMiddle East & North Africa (excluding high income)Middle East & North Africa (IDA & IBRD countries)Middle incomeMoldovaMongoliaMontenegroMoroccoMozambiqueMyanmarNamibiaNepalNetherlandsNew ZealandNicaraguaNigerNigeriaNorth AmericaNorwayOECD membersOmanOther small statesPacific island small statesPakistanPalauPanamaParaguayPeruPhilippinesPolandPortugalPost-demographic dividendPre-demographic dividendQatarRomaniaRussian FederationSamoaSao Tome and PrincipeSaudi ArabiaSenegalSerbiaSeychellesSingaporeSlovak RepublicSloveniaSmall statesSolomon IslandsSouth AfricaSouth AsiaSouth Asia (IDA & IBRD)South SudanSpainSri LankaSt. Kitts and NevisSt. LuciaSt. Vincent and the GrenadinesSub-Saharan Africa Sub-Saharan Africa (excluding high income)Sub-Saharan Africa (IDA & IBRD countries)SudanSurinameSwazilandSwedenSwitzerlandSyrian Arab RepublicTajikistanTanzaniaThailandTimor-LesteTogoTongaTrinidad and TobagoTunisiaTurkeyUkraineUnited Arab EmiratesUnited KingdomUnited StatesUpper middle incomeUruguayUzbekistanVanuatuVenezuela, RBVietnamWorldYemen, Rep.ZambiaZimbabwe La ligne de temps
Cette échelle de temps montre un graphique de 1972 année à 2014 année Tunisia. Les données jusqu'à 1971 année ne sont pas présentés. Quantité d'observations actuelles selon dates: 43.
Source (désignation):
Les indicateurs du développement mondiale
Source (organisation):
IEA Statistics © OECD/IEA 2014 (http://www.iea.org/stats/index.asp), subject to https://www.iea.org/t&c/termsandconditions/
Catégories:
Energy & Mining
Dernière mise à jour
23 avr. 2017
Les indicateurs de changement de valeurs selon les années
Minimum:
74.664
1 janv. 1972
Maximum:
88.29
1 janv. 2014
Pour la date d''observation
Valeur
Changement absolu
Le changement par rapport à la valeur précédente
1 janv. 1972
74.664
+74.664
0.0%
1 janv. 1973
76.482
+1.818
2.44%
1 janv. 1974
77.004
+0.522
0.68%
1 janv. 1975
79.217
+2.212
2.87%
1 janv. 1976
79.486
+0.27
0.34%
1 janv. 1977
80.254
+0.768
0.97%
1 janv. 1978
81.438
+1.184
1.48%
1 janv. 1979
82.654
+1.217
1.49%
1 janv. 1980
83.566
+0.911
1.1%
1 janv. 1981
84.556
+0.99
1.18%
1 janv. 1982
84.608
+0.053
0.06%
1 janv. 1983
83.948
-0.66
-0.78%
1 janv. 1984
85.499
+1.55
1.85%
1 janv. 1985
86.162
+0.663
0.78%
1 janv. 1986
85.989
-0.173
-0.2%
1 janv. 1987
85.526
-0.462
-0.54%
1 janv. 1988
85.302
-0.224
-0.26%
1 janv. 1989
85.903
+0.601
0.7%
1 janv. 1990
85.588
-0.316
-0.37%
1 janv. 1991
87.023
+1.436
1.68%
1 janv. 1992
86.456
-0.568
-0.65%
1 janv. 1993
87.675
+1.219
1.41%
1 janv. 1994
86.755
-0.92
-1.05%
1 janv. 1995
86.89
+0.134
0.15%
1 janv. 1996
86.975
+0.085
0.1%
1 janv. 1997
86.917
-0.058
-0.07%
1 janv. 1998
86.771
-0.146
-0.17%
1 janv. 1999
87.321
+0.551
0.63%
1 janv. 2000
87.166
-0.155
-0.18%
1 janv. 2001
87.118
-0.048
-0.06%
1 janv. 2002
87.319
+0.201
0.23%
1 janv. 2003
87.073
-0.245
-0.28%
1 janv. 2004
86.806
-0.267
-0.31%
1 janv. 2005
87.044
+0.238
0.27%
1 janv. 2006
86.324
-0.72
-0.83%
1 janv. 2007
86.586
+0.262
0.3%
1 janv. 2008
86.594
+0.008
0.01%
1 janv. 2009
86.7
+0.106
0.12%
1 janv. 2010
85.962
-0.738
-0.85%
1 janv. 2011
87.686
+1.724
2.01%
1 janv. 2012
88.072
+0.385
0.44%
1 janv. 2013
88.265
+0.193
0.22%
1 janv. 2014
88.29
+0.025
0.03%
Classement des pays selon les statistiques actuelles par années


Commentaires: