29
/fr/
fr
AIzaSyAYiBZKx7MnpbEhh9jyipgxe19OcubqV5w
April 1, 2024
264661
Togo
TGO
true
2
1
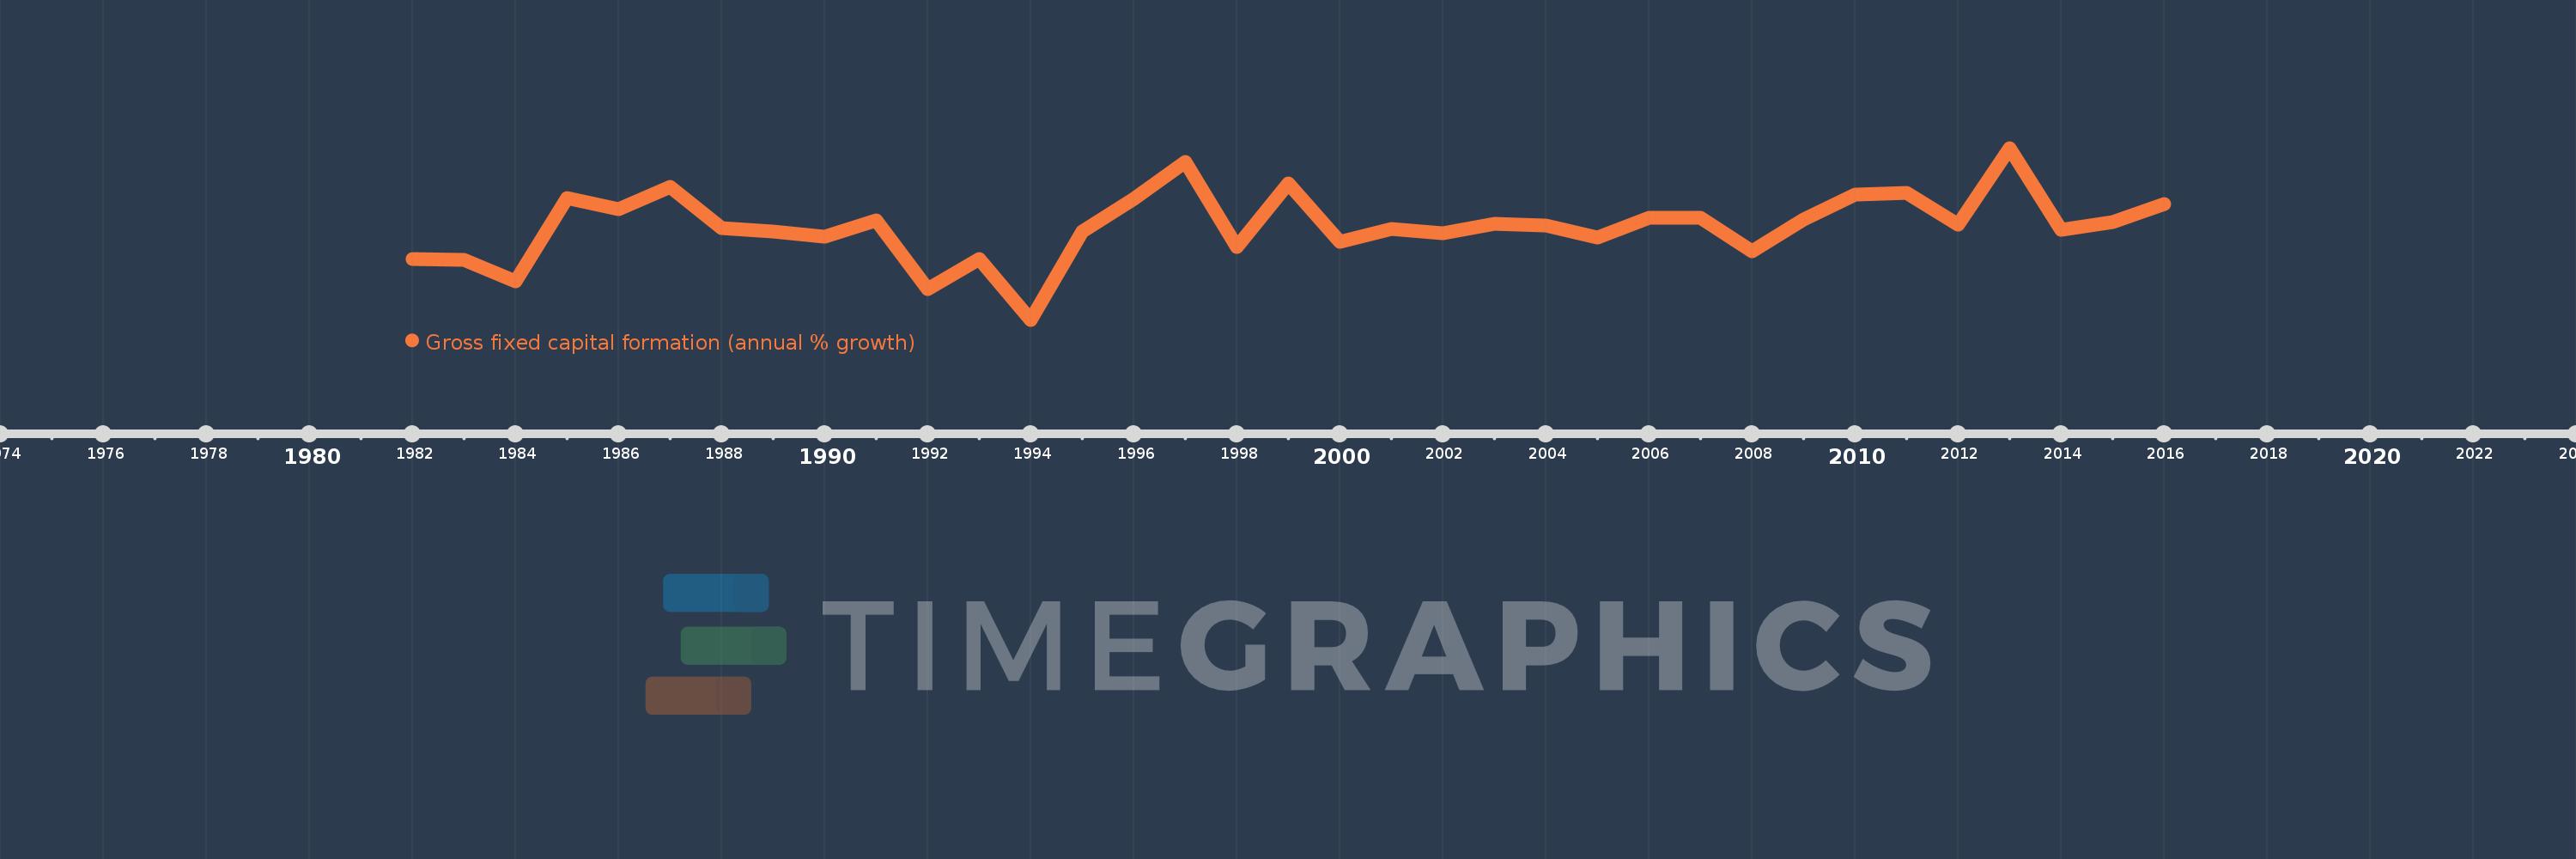
Gross fixed capital formation (annual % growth)
2016,2015,2014,2013,2012,2011,2010,2009,2008,2007,2006,2005,2004,2003,2002,2001,2000,1999,1998,1997,1996,1995,1994,1993,1992,1991,1990,1989,1988,1987,1986,1985,1984,1983,1982
Cette statistique dans les autres pays:
AlbaniaAlgeriaAntigua and BarbudaArab WorldArgentinaArmeniaAustraliaAustriaAzerbaijanBahamas, TheBahrainBangladeshBarbadosBelarusBelgiumBelizeBeninBhutanBoliviaBosnia and HerzegovinaBotswanaBrazilBrunei DarussalamBulgariaBurkina FasoBurundiCabo VerdeCambodiaCameroonCanadaCaribbean small statesCentral Europe and the BalticsChadChileChinaColombiaComorosCongo, Dem. Rep.Congo, Rep.Costa RicaCote d'IvoireCroatiaCubaCyprusCzech RepublicDenmarkDjiboutiDominican RepublicEarly-demographic dividendEast Asia & PacificEast Asia & Pacific (excluding high income)East Asia & Pacific (IDA & IBRD countries)EcuadorEgypt, Arab Rep.El SalvadorEquatorial GuineaEritreaEstoniaEthiopiaEuro areaEurope & Central AsiaEurope & Central Asia (excluding high income)Europe & Central Asia (IDA & IBRD countries)European UnionFinlandFranceGabonGambia, TheGeorgiaGermanyGhanaGreeceGuatemalaGuineaGuinea-BissauHaitiHeavily indebted poor countries (HIPC)High incomeHondurasHong Kong SAR, ChinaHungaryIBRD onlyIcelandIDA & IBRD totalIDA blendIDA onlyIDA totalIndiaIndonesiaIran, Islamic Rep.IrelandIsraelItalyJamaicaJapanJordanKazakhstanKenyaKorea, Rep.KosovoKyrgyz RepublicLao PDRLate-demographic dividendLatin America & Caribbean Latin America & Caribbean (excluding high income)Latin America & the Caribbean (IDA & IBRD countries)LatviaLeast developed countries: UN classificationLebanonLiberiaLithuaniaLow & middle incomeLow incomeLower middle incomeLuxembourgMacao SAR, ChinaMacedonia, FYRMadagascarMalawiMalaysiaMaliMaltaMauritaniaMauritiusMexicoMiddle East & North AfricaMiddle East & North Africa (excluding high income)Middle East & North Africa (IDA & IBRD countries)Middle incomeMoldovaMongoliaMontenegroMoroccoMozambiqueNamibiaNepalNetherlandsNew ZealandNicaraguaNigerNigeriaNorth AmericaNorwayOECD membersOmanPakistanPanamaPapua New GuineaParaguayPeruPhilippinesPolandPortugalPost-demographic dividendPre-demographic dividendPuerto RicoRomaniaRussian FederationRwandaSaudi ArabiaSenegalSerbiaSeychellesSierra LeoneSingaporeSlovak RepublicSloveniaSomaliaSouth AfricaSouth AsiaSouth Asia (IDA & IBRD)South SudanSpainSri LankaSub-Saharan Africa Sub-Saharan Africa (excluding high income)Sub-Saharan Africa (IDA & IBRD countries)SudanSurinameSwazilandSwedenSwitzerlandSyrian Arab RepublicTajikistanTanzaniaThailandTimor-LesteTogoTrinidad and TobagoTunisiaTurkeyUgandaUkraineUnited Arab EmiratesUnited KingdomUnited StatesUpper middle incomeUruguayUzbekistanVanuatuVenezuela, RBVietnamWest Bank and GazaWorldZimbabwe La ligne de temps
Cette échelle de temps montre un graphique de 1982 année à 2016 année Togo. Les données jusqu'à 1981 année ne sont pas présentés. Quantité d'observations actuelles selon dates: 35.
Source (désignation):
Les indicateurs du développement mondiale
Source (organisation):
World Bank national accounts data, and OECD National Accounts data files.
Catégories:
Economy & Growth
Dernière mise à jour
23 avr. 2017
Les indicateurs de changement de valeurs selon les années
Minimum:
-45.8
1 janv. 1994
Maximum:
48.022
1 janv. 2013
Pour la date d''observation
Valeur
Changement absolu
Le changement par rapport à la valeur précédente
1 janv. 1982
-12.583
-12.583
0.0%
1 janv. 1983
-13.068
-0.485
3.86%
1 janv. 1984
-24.619
-11.55
88.39%
1 janv. 1985
20.809
+45.428
-184.53%
1 janv. 1986
14.354
-6.455
-31.02%
1 janv. 1987
26.708
+12.354
86.06%
1 janv. 1988
4.261
-22.447
-84.05%
1 janv. 1989
2.539
-1.722
-40.41%
1 janv. 1990
-0.487
-3.025
-119.17%
1 janv. 1991
8.473
+8.96
-1.84 milles%
1 janv. 1992
-28.961
-37.434
-441.8%
1 janv. 1993
-12.4
+16.561
-57.18%
1 janv. 1994
-45.8
-33.4
269.35%
1 janv. 1995
2.2
+48.0
-104.8%
1 janv. 1996
20.2
+18.0
818.18%
1 janv. 1997
40.607
+20.407
101.03%
1 janv. 1998
-6.166
-46.773
-115.18%
1 janv. 1999
28.43
+34.596
-561.07%
1 janv. 2000
-3.303
-31.733
-111.62%
1 janv. 2001
3.796
+7.099
-214.95%
1 janv. 2002
1.647
-2.149
-56.61%
1 janv. 2003
6.51
+4.863
295.23%
1 janv. 2004
5.873
-0.637
-9.79%
1 janv. 2005
-0.724
-6.597
-112.33%
1 janv. 2006
9.909
+10.633
-1.47 milles%
1 janv. 2007
9.825
-0.084
-0.84%
1 janv. 2008
-8.181
-18.007
-183.27%
1 janv. 2009
9.098
+17.28
-211.21%
1 janv. 2010
22.499
+13.4
147.28%
1 janv. 2011
23.524
+1.025
4.56%
1 janv. 2012
5.946
-17.577
-74.72%
1 janv. 2013
48.022
+42.076
707.62%
1 janv. 2014
3.092
-44.93
-93.56%
1 janv. 2015
7.545
+4.453
144.02%
1 janv. 2016
17.552
+10.007
132.62%
Classement des pays selon les statistiques actuelles par années


Commentaires: