29
/fr/
fr
AIzaSyAYiBZKx7MnpbEhh9jyipgxe19OcubqV5w
April 1, 2024
263534
Timor-Leste
TLS
true
2
1
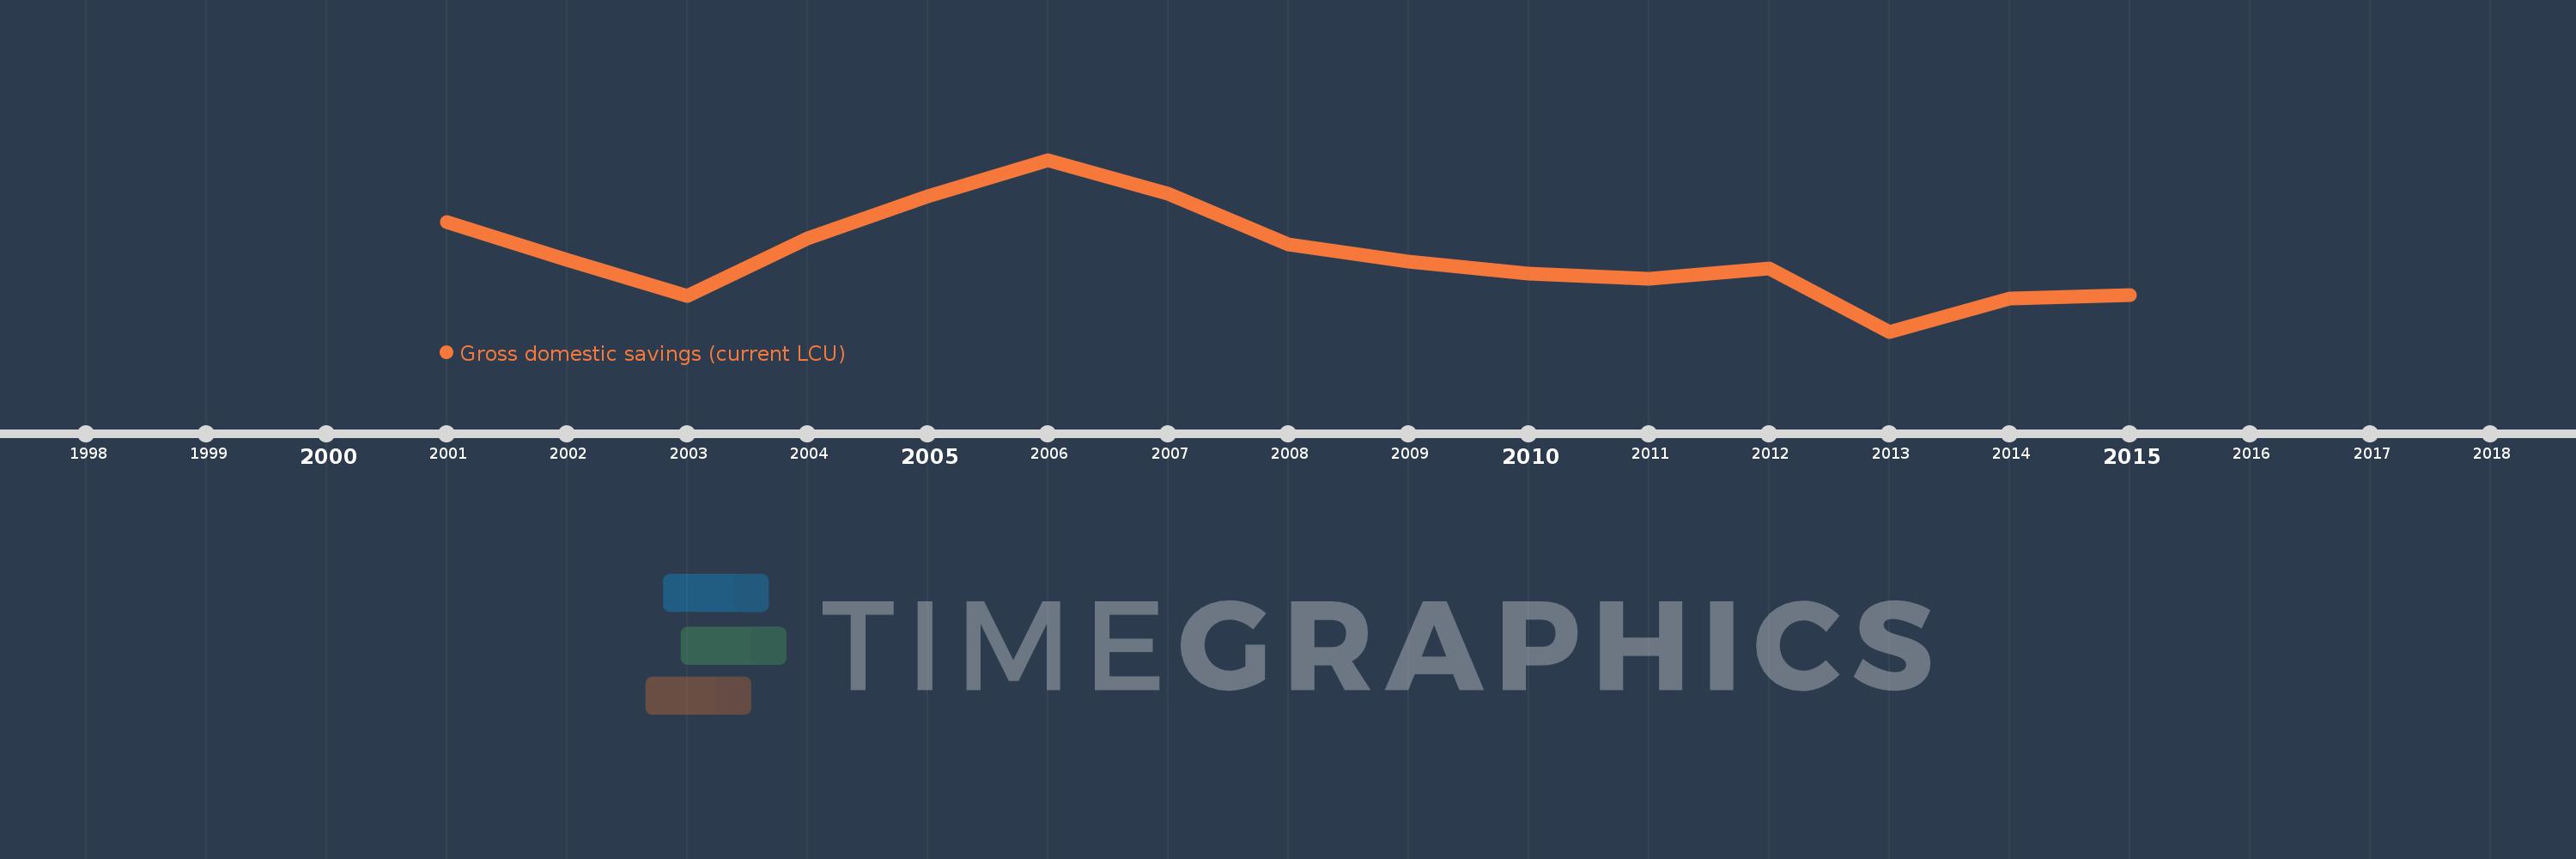
Gross domestic savings (current LCU)
2015,2014,2013,2012,2011,2010,2009,2008,2007,2006,2005,2004,2003,2002,2001
Cette statistique dans les autres pays:
AfghanistanAlbaniaAlgeriaAngolaAntigua and BarbudaArgentinaArmeniaArubaAustraliaAustriaAzerbaijanBahamas, TheBahrainBangladeshBarbadosBelarusBelgiumBelizeBeninBermudaBhutanBoliviaBosnia and HerzegovinaBotswanaBrazilBrunei DarussalamBulgariaBurkina FasoBurundiCabo VerdeCambodiaCameroonCanadaCentral African RepublicChadChileChinaColombiaComorosCongo, Dem. Rep.Congo, Rep.Costa RicaCote d'IvoireCroatiaCubaCyprusCzech RepublicDenmarkDjiboutiDominicaDominican RepublicEcuadorEgypt, Arab Rep.El SalvadorEquatorial GuineaEritreaEstoniaEthiopiaFaroe IslandsFijiFinlandFranceGabonGambia, TheGeorgiaGermanyGhanaGreeceGrenadaGuatemalaGuineaGuinea-BissauGuyanaHaitiHondurasHong Kong SAR, ChinaHungaryIcelandIndiaIndonesiaIran, Islamic Rep.IraqIrelandIsraelItalyJamaicaJapanJordanKazakhstanKenyaKiribatiKorea, Rep.KosovoKuwaitKyrgyz RepublicLao PDRLatviaLebanonLesothoLiberiaLibyaLithuaniaLuxembourgMacao SAR, ChinaMacedonia, FYRMadagascarMalawiMalaysiaMaldivesMaliMaltaMauritaniaMauritiusMexicoMicronesia, Fed. Sts.MoldovaMongoliaMontenegroMoroccoMozambiqueNamibiaNepalNetherlandsNew CaledoniaNew ZealandNicaraguaNigerNigeriaNorwayOmanPakistanPanamaPapua New GuineaParaguayPeruPhilippinesPolandPortugalPuerto RicoQatarRomaniaRussian FederationRwandaSaudi ArabiaSenegalSerbiaSeychellesSierra LeoneSingaporeSlovak RepublicSloveniaSolomon IslandsSomaliaSouth AfricaSouth SudanSpainSri LankaSt. Kitts and NevisSt. LuciaSt. Vincent and the GrenadinesSudanSurinameSwazilandSwedenSwitzerlandSyrian Arab RepublicTajikistanTanzaniaThailandTimor-LesteTogoTongaTrinidad and TobagoTunisiaTurkeyTurkmenistanUgandaUkraineUnited Arab EmiratesUnited KingdomUnited StatesUruguayUzbekistanVanuatuVenezuela, RBVietnamWest Bank and GazaYemen, Rep.ZambiaZimbabwe La ligne de temps
Cette échelle de temps montre un graphique de 2001 année à 2015 année Timor-Leste. Les données jusqu'à 2000 année ne sont pas présentés. Quantité d'observations actuelles selon dates: 15.
Source (désignation):
Les indicateurs du développement mondiale
Source (organisation):
World Bank national accounts data, and OECD National Accounts data files.
Catégories:
Economy & Growth
Dernière mise à jour
23 avr. 2017
Les indicateurs de changement de valeurs selon les années
Minimum:
-799.0 mln.
1 janv. 2013
Maximum:
-180.0 mln.
1 janv. 2006
Pour la date d''observation
Valeur
Changement absolu
Le changement par rapport à la valeur précédente
1 janv. 2001
-403.0 mln.
-403.0 mln.
0.0%
1 janv. 2002
-542.0 mln.
-139.0 mln.
34.49%
1 janv. 2003
-672.0 mln.
-130.0 mln.
23.99%
1 janv. 2004
-464.0 mln.
+208.0 mln.
-30.95%
1 janv. 2005
-310.0 mln.
+154.0 mln.
-33.19%
1 janv. 2006
-180.0 mln.
+130.0 mln.
-41.94%
1 janv. 2007
-303.0 mln.
-123.0 mln.
68.33%
1 janv. 2008
-486.0 mln.
-183.0 mln.
60.4%
1 janv. 2009
-546.0 mln.
-60.0 mln.
12.35%
1 janv. 2010
-590.0 mln.
-44.0 mln.
8.06%
1 janv. 2011
-610.0 mln.
-20.0 mln.
3.39%
1 janv. 2012
-571.0 mln.
+39.0 mln.
-6.39%
1 janv. 2013
-799.0 mln.
-228.0 mln.
39.93%
1 janv. 2014
-681.0 mln.
+118.0 mln.
-14.77%
1 janv. 2015
-668.0 mln.
+13.0 mln.
-1.91%
Classement des pays selon les statistiques actuelles par années


Commentaires: