29
/fr/
fr
AIzaSyAYiBZKx7MnpbEhh9jyipgxe19OcubqV5w
April 1, 2024
26216
Central Europe and the Baltics
CEB
false
2
1
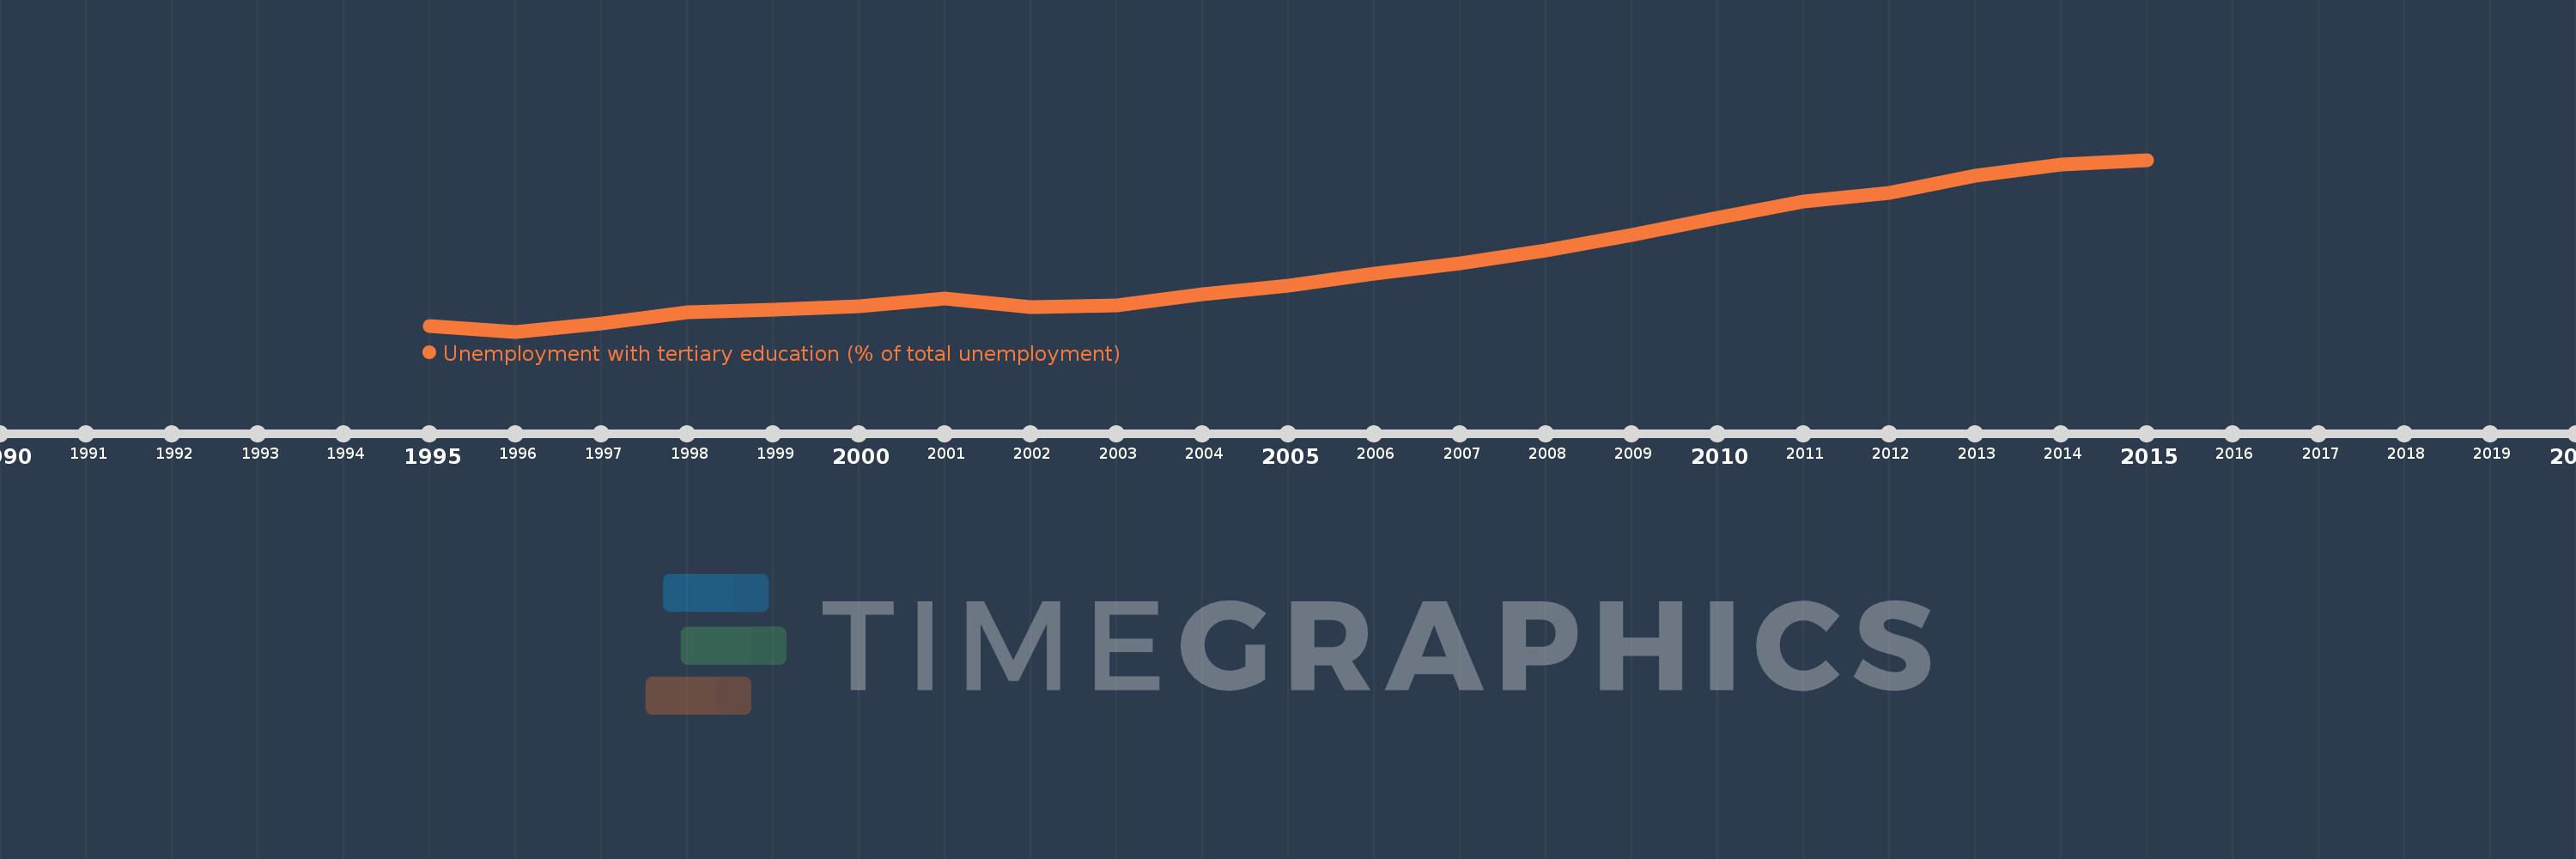
Unemployment with tertiary education (% of total unemployment)
2015,2014,2013,2012,2011,2010,2009,2008,2007,2006,2005,2004,2003,2002,2001,2000,1999,1998,1997,1996,1995
Cette statistique dans les autres pays:
La ligne de temps
Cette échelle de temps montre un graphique de 1995 année à 2015 année Central Europe and the Baltics. Les données jusqu'à 1994 année ne sont pas présentés. Quantité d'observations actuelles selon dates: 21.
Source (désignation):
Les indicateurs du développement mondiale
Source (organisation):
International Labour Organization, Key Indicators of the Labour Market database.
Catégories:
Social Protection & Labor
Dernière mise à jour
23 avr. 2017
Les indicateurs de changement de valeurs selon les années
Minimum:
4.017
1 janv. 1996
Maximum:
14.43
1 janv. 2015
Pour la date d''observation
Valeur
Changement absolu
Le changement par rapport à la valeur précédente
1 janv. 1995
4.375
+4.375
0.0%
1 janv. 1996
4.017
-0.358
-8.19%
1 janv. 1997
4.527
+0.51
12.69%
1 janv. 1998
5.213
+0.686
15.16%
1 janv. 1999
5.362
+0.15
2.87%
1 janv. 2000
5.538
+0.176
3.28%
1 janv. 2001
6.005
+0.467
8.43%
1 janv. 2002
5.507
-0.498
-8.29%
1 janv. 2003
5.58
+0.072
1.31%
1 janv. 2004
6.265
+0.686
12.29%
1 janv. 2005
6.815
+0.549
8.77%
1 janv. 2006
7.517
+0.702
10.3%
1 janv. 2007
8.136
+0.619
8.23%
1 janv. 2008
8.912
+0.777
9.55%
1 janv. 2009
9.886
+0.974
10.92%
1 janv. 2010
10.929
+1.042
10.54%
1 janv. 2011
11.894
+0.965
8.83%
1 janv. 2012
12.449
+0.555
4.67%
1 janv. 2013
13.478
+1.03
8.27%
1 janv. 2014
14.135
+0.656
4.87%
1 janv. 2015
14.43
+0.295
2.09%
Classement des pays selon les statistiques actuelles par années


Commentaires: